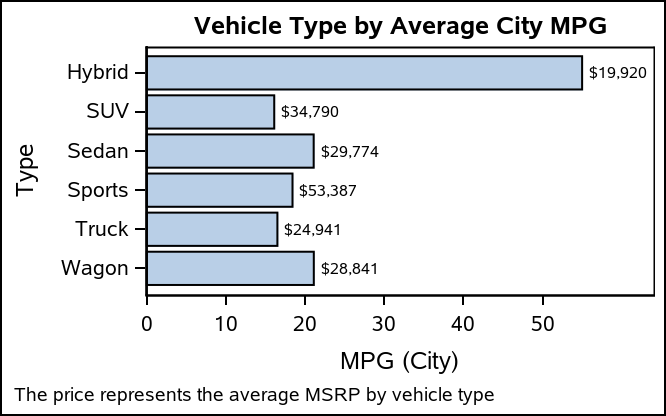
When creating bar charts, it is very common to display labels with the bars to make it easier to determine the bar values or to provide additional information in the chart. However, these labels can take away valuable data space, particularly if you generate a smaller-sized graph. As you see in the graph below, axis offsets reserve space for the bar labels so that they are fully contained within the data area. These offsets can take away space that could be used by the bar chart, particularly when horizontally-oriented.
Here are some tips and tricks on how to label your bars in a way to optimize the space for your bar chart.
Label Positioning
For these examples.I wanted to compute both the average MPG and the average MSRP for display. Therefore, I used PROC SUMMARY to precompute the data.
proc summary data=sashelp.cars nway;
   class type;
   var mpg_city msrp;
   output out=cars mean=;
run;
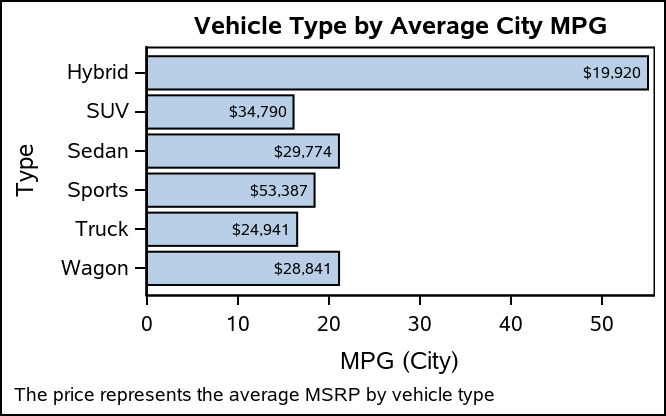
For horizontal bar charts, there is a DATALABELFITPOLICY available called INSIDEPREFERRED. This policy will put all bar labels inside the bar, unless the bar is too small to contain the label. In that case, the label is placed outside of the small bar. The result is a bar chart that almost always has no axis offsets created for the bar labels. This option is available on all flavors of horizontal bar chart in the SGPLOT and SGPANEL procedures.
proc sgplot data=cars;
   hbarparm category=type response=mpg_city / datalabel=msrp
                          datalabelfitpolicy=insidepreferred;
run;
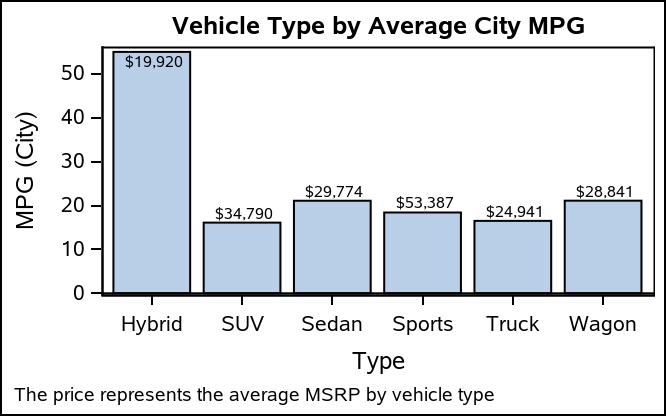
For vertical bar charts, this fit policy is not available; however, you still have a creative option. Instead of using the DATALABEL option on the bar chart, overlay a TEXT plot on top of the bar chart. This plot gives you a lot of control on how text is plotted around a data point. Using the data point as an anchor, the POSITION option gives you the ability to specify any of nine positions for the text. In addition, you can specify those positions using a data set variable. You can use this option to dynamically move the text inside or outside of a bar.
In the data steps below, I assigned a position value in the "pos" variable, based on a value that is roughly in the middle of the data range. You can tune this value to be closer to the max value if you know you have smaller labels. For a vertical bar chart, you will need to use the "top" and "bottom" values, while you should use the "left" and "right" values for horizontal bar charts.
data cars_hor;
  set cars;
  length pos $ 5;
  if mpg_city > 30 then pos="left";
  else pos="right";
run;

data cars_ver;
  set cars;
  length pos $ 6;
  if mpg_city > 30 then pos="bottom";
  else pos="top";
run;
The other key option needed on the TEXT plot is the CONTRIBUTEOFFSETS option. This option gives you the ability to specify which axis offsets can be affected by the TEXT plot content. Ny default. the longest string in the TEXT plot is used to contribute to all axis offset calculations. In this case, the labels are within the bars, so we do not want the text to impact the offsets. Therefore, I set the value to NONE.
proc sgplot data=cars_ver noautolegend;
   vbarparm category=type response=mpg_city;
   text x=type y=mpg_city text=msrp / position=pos contributeoffsets=none;
run;
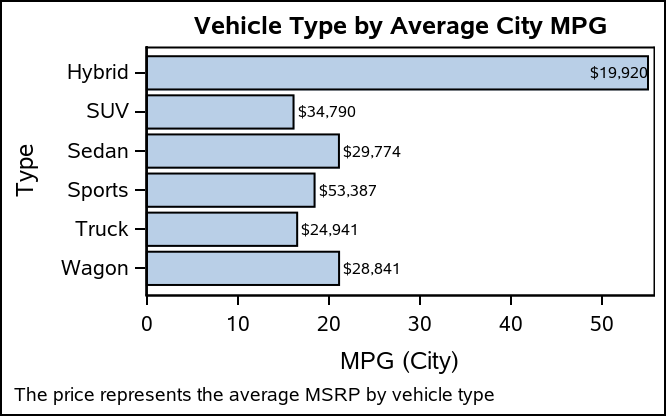
This approach also works in the horizontal directions.
proc sgplot data=cars_hor noautolegend;
   hbarparm category=type response=mpg_city;
   text y=type x=mpg_city text=msrp / position=pos contributeoffsets=none;
run;
Two-label Support
Now that you know how to add and position a custom label, you can now enhance the bar labeling by having two labels. You can either use two TEXT plots or combine a TEXT plot with a regular bar label, In the examples below, I used the POSITION option to explicitly set the position of the TEXT plot values to be inside of the bar, while using the DATALABEL option to turn on the standard bar chart label.
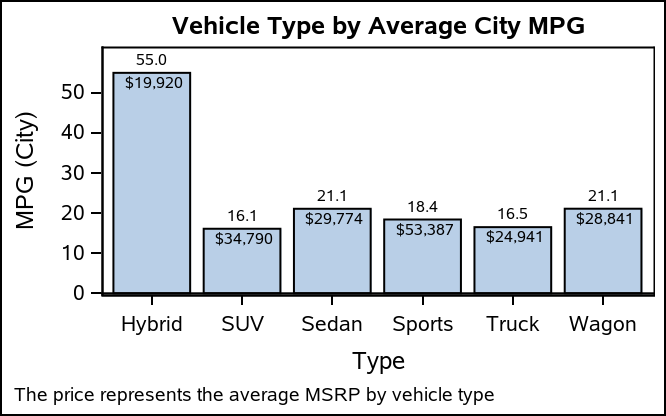
Vertical
proc sgplot data=cars noautolegend;
   format mpg_city 4.1;
   vbarparm category=type response=mpg_city / datalabel;
   text x=type y=mpg_city text=msrp / position=bottom contributeoffsets=none;
run;
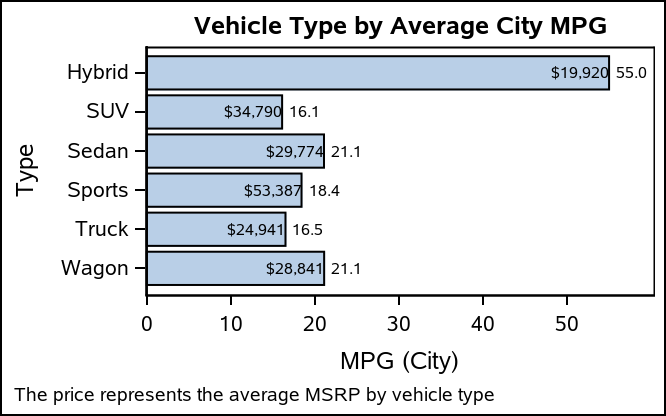
Horizontal
proc sgplot data=cars noautolegend;
   format mpg_city 4.1;
   hbarparm category=type response=mpg_city / datalabel;
   text y=type x=mpg_city text=msrp / position=left contributeoffsets=none;
run;
Final Notes
When using the SG procedures, the TEXT plot technique cannot be used with a VBAR or HBAR statement. You must either pre-summarize the data and use a VBARPARM or HBARPARM statement, or just use a VBARBASIC or HBARBASIC statement. For Graph Template Language (GTL) users, this technique is done by overlaying either a BARCHART or BARCHARTPARM statement with one or more TEXTPLOT statements. I hope you find this useful!