The asymptotic expected value of the range for normal data

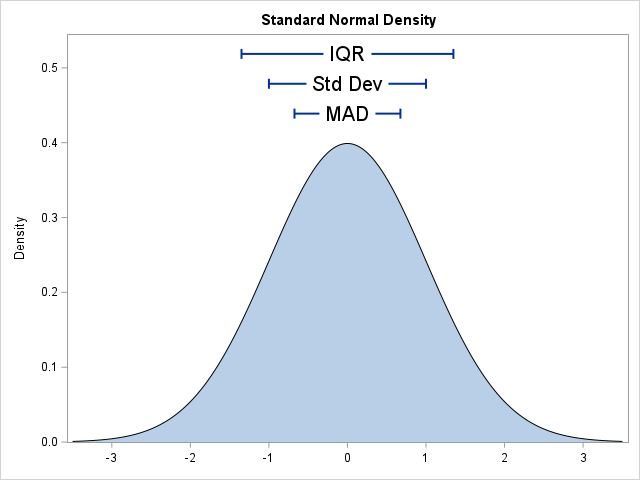
A previous article shows how to compute various robust estimates of scale in SAS. In that article, I show how to scale these robust estimators so that they become consistent estimators of the standard deviation (σ) when the data are normally distributed. The scaling factor is related to the expected