At a recent conference in Las Vegas, a presenter simulated the sum of two dice and used it to simulate the game of craps. I write a lot of simulations, so I'd like to discuss two related topics:
- How to simulate the sum of two dice in SAS. This is trivial.
- How to convince yourself that the simulation is correct. This is more interesting!
Simulate the sum of two dice
It is easy to simulate the sum of two six-sided dice by using the DATA step in SAS. For fair dice, each face has a probability of 1/6 of appearing. You can simulate rolling a die in either of two ways. Older SAS programmers will probably use an expression such as CEIL(6*RAND("Uniform")), which generates the integers 1–6 with equal probability. However, an equivalent (and clearer!) syntax is to use the "Integer" distribution to generate the integers directly, as follows:
/* Simulate 1,000 rolls of two dice. Report the sum of the faces. */ data Dice1; call streaminit(1234); do i = 1 to 1000; d1 = rand("Integer", 1, 6); d2 = rand("Integer", 1, 6); sum = d1 + d2; output; end; run; |
The Dice1 data set contains 1,000 simulated dice rolls. Each row displays the face of each die and the sum of the faces.
Is the simulation correct?
When you create a simulated data set, it is important to assess whether the simulation is correct. There are a few techniques that I like to use. In increasing order of complexity, they are:
- Graph the simulated data. Do they look like they are supposed to?
- Compute simple descriptive statistics. For the simulation of a continuous quantity, this might include computing the mean (expected values) and standard deviation of a large sample. For a discrete distribution, this might include a frequency analysis of the categories. For a large sample, are the sample estimates close to the true values for the distribution?
- Use a formal hypothesis test to assess whether the simulated sample is likely to have come from the parent distribution. This could include a test of the mean or a goodness-of-fit test, to give two examples.
Assessing the simulation of the sum of two dice
To assess the correctness of the simulation, it is useful to know the exact distribution of the model from which you are drawing random samples. For the sum of two dice, you can use a simple counting argument to show that the discrete probability distribution is triangular:
- The probability that the sum is 2 is 1/36. Also, the probability that the sum 12 is 1/36. In symbols, you can write Pr(sum=2) = Pr(sum=12) = 1/36 = 0.027...
- Pr(sum=3) = Pr(sum=11) = 2/36 = 0.055...
- Pr(sum=4) = Pr(sum=10) = 3/36 = 0.083...
- Pr(sum=5) = Pr(sum=9) = 4/36 = 0.111...
- Pr(sum=6) = Pr(sum=8) = 5/36 = 0.138...
- Pr(sum=7) = 6/36 = 0.166...
For a discrete distribution, you can use PROC FREQ to count the number of observations for each category and to graph the frequency distribution, as follows:
proc freq data=Dice1; tables sum / nocum plots=freqplot(scale=percent); run; |

The FREQ procedure outputs a table of counts and percentages (not shown) and a bar chart that shows the same information. The bar chart gives you faith that the simulation is correct because the heights of the bars are close to the theoretical probabilities. The sums range from 2 to 12, with 6, 7, and 8 being the most common rolls. The distribution of the sums is roughly symmetric.
However, you might be concerned that the empirical distribution does not show a prominent peak at 7. Does the graph show the kind of variation that you should expect in a random sample of size N=1,000, or is the asymmetry showing some insidious error in the program or in the RAND function in SAS?
A chi-square test for the frequency distribution
To answer that question, you can run a hypothesis test that tests the empirical frequencies of the samples against the expected values for the discrete triangular distribution. The null hypothesis is that the observed frequencies are from a discrete probability distribution that has a specified table of probabilities. In PROC FREQ, the TESTP= option enables you to specify the expected probabilities for each category, and the CHISQ option requests a chi-square test that compares the empirical and expected frequencies, as follows:
/* exact probabilities for the sum of two dice */ %let probSum = 0.0277777778 0.0555555556 0.0833333333 0.1111111111 0.1388888889 0.1666666667 0.1388888889 0.1111111111 0.0833333333 0.0555555556 0.0277777778; proc freq data=Dice1; tables sum / nocum chisq testp=(&probSum); run; |
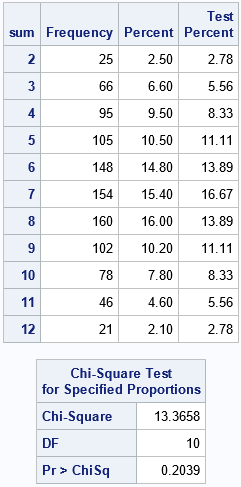
For each of the 11 possible sums, PROC FREQ displays the sample percentages and the expected percentages under the hypothesis that the sums are distributed according to the probabilities specified in the TESTP= option. You can see that the empirical percentages are close to the expected values. Furthermore, the CHISQ option produces a table that shows the result of a chi-square test for the specified proportions. The test statistic is the sum of the quantities (frequency[i]– expected[i])2 / expected[i], where frequency[i]is the observed count and expected[i]is the expected value under the null hypothesis. For these simulated data, the p-value for the test (0.2039) is not very small, so there is no reason to reject the null hypothesis. We conclude that there is no evidence to doubt that these simulated data are drawn from the distribution for the sum of two fair six-sided dice.
Summary and concluding thoughts
In summary, this article shows how to use the DATA step to simulate tossing a pair of six-sided dice. After simulating the data, you might wonder whether the simulation was correct. You can visualize the distribution of the sample to check whether it has the correct shape. You can use statistical hypothesis tests if you need further evidence that the sample has the statistical properties that you would expect in random sample from a known probability distribution.
But here's a dirty little secret: Even if the simulation is correct, the hypothesis test will REJECT the null hypothesis 5% of the time (assuming an α = 0.05 significance level). So, if the test rejects the null hypothesis, how do you know whether your simulation is wrong or if you just got unlucky? One thing you can do is to change the random number seed and rerun the test again. Did the test reject the null again? If so, you probably have a problem in your simulation. But if the second run does not reject the null, your simulation might be okay.
I am not suggesting that your rerun a test until you get a p-value that you like! In practice, you need to have confidence in your simulation. There are principled ways to check the validity of a simulation. They require that you generate many samples and look at the distribution of statistics across the random samples. I discuss these issues in a subsequent article.

1 Comment
Pingback: On the correctness of a discrete simulation - The DO Loop