An unobserved category is one that does not appear in a sample of data. For example, in a small sample of US voters, you are likely to observe members of the major political parties, but less likely to observe members of minor or fringe parties. This can cause a headache for the data analyst. If the sample does not contain any members of the Libertarian party, how do you include that information in a table of statistics?
This article shows how to use Base SAS to ensure that all subgroups in a data set are displayed, even those that are not observed in the data. Since PROC MEANS is an important procedure for generating descriptive statistics, this article emphasizes two useful options in PROC MEANS: the CLASSDATA= option, which enables you to specify the (joint) levels of categorical variables, and the COMPLETETYPES option, which tells the procedure to assume that unobserved categories have zero counts. The article focuses on one-way and two-way analyses, which involve either one or two CLASS variables, respectively.
A one-way analysis for observed categories
Suppose you use a list of registered voters to obtain the affiliation, gender, and age for a small random sample. You want to generate a table of descriptive statistics cross-classified by political affiliation. The following call to PROC MEANS carries out the analysis on a hypothetical random sample:
/* a one-way analysis of age by political affiliation */ data Survey; length Affiliation $14; input Affiliation Gender $ Age; datalines; Democratic F 22 Independent F 56 Republican M 68 Democratic M 45 Independent F 29 Republican M 71 Republican F 52 Republican M 59 Democratic F 42 Republican F 31 Democratic F 40 ; proc means data=Survey maxdec=2; class Affiliation; var Age; run; |
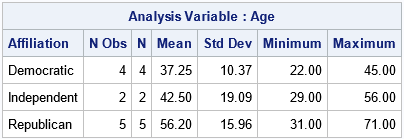
The output shows descriptive statistics for the categories that are observed, but says nothing about the unobserved political parties.
A one-way analysis that shows unobserved categories
Perhaps one goal of the report is to discuss the age distribution of the members of the Green and Libertarian parties. Because the proportion of the population that belongs to these parties is relatively small, the sample does not contain any Green or Libertarian members. Nevertheless, it is possible to include these parties in the table of statistics and show 0 as the number of observations in the sample. There are a few ways to include additional political parties in the table of statistics:
- I've previously written about a general technique, which is to create a new "fake" data set that contains all categories and prepend the new data to the observed data. (You could use a DATA step view for this operation.) For the "fake observations," SAS automatically assigns missing values to all variables in the observed data that are not part of the fake data set. The resulting concatenated data contains at least one row for all categories. A drawback of the general method is that you must modify the observed data to include all valid CLASS levels, then analyze the modified data. Also, some procedures will count the fake data when reporting the size of the sample.
- If you are using PROC MEANS for the analysis, you can perform the same trick without modifying the data by using the CLASSDATA= option. The CLASSDATA= option enables you to specify a data set that contains all relevant levels of the CLASS variable. PROC MEANS will include all these levels in its output even if a level is not observed in the data.
The following statements demonstrate how to use the CLASSDATA= option in PROC MEANS. You must first create a SAS data set that contains all affiliations of interest:
/* list all affiliations that you want in the output */ data Parties; length Affiliation $14; input Affiliation; datalines; Democratic Green Independent Libertarian Republican ; proc means data=Survey maxdec=2 CLASSDATA=Parties; class Affiliation; var Age; run; |
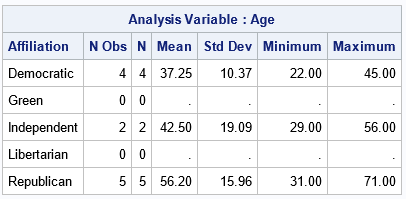
Because of the CLASSDATA= option, the output shows a row for every level of the Affiliation variable that is specified in the Parties data set. For the unobserved categories, the analysis assigns zero counts and missing values for the statistics.
A two-way analysis that shows unobserved categories
The sample data include an additional categorical variable, Gender. Let's see what happens if we include Gender as a second CLASS variable and do not use the CLASSDATA= option:
/* only the observed joint levels are shown */ proc means data=Survey maxdec=2 N Mean Min Max; class Affiliation Gender; var Age; run; |
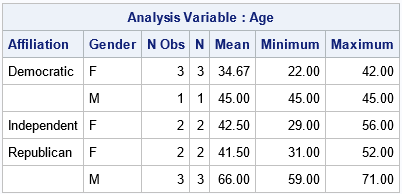
Notice that in the data we did not observe any male voters who listed "Independent" as an affiliation. Consequently, the output table contains only five rows. To emphasize the fact that no male independents were surveyed, you might want to include an additional row for "Independent males" in the output.
There are two ways to add the additional row to the output:
- A general technique is to imitate the method in the previous section. Namely, create a data set that contains all the joint levels of the Affiliation and Gender variables that you want to report. Then either concatenate that fake data with the survey data or use the CLASSDATA= option in PROC MEANS.
- PROC MEANS supports another option that can be useful: The COMPLETETYPES option ensures that the output contains all joint combinations of the class variables. You can use this option when each class variable contains all levels that you are interested in, but some of the joint levels are unobserved.
Let's look at the COMPLETETYPES option to understand how it works. For these data, a one-way analysis of the Affiliation variable shows that the data contain the three levels "Democratic", "Independent", and "Republican". A one-way analysis of the Gender variable shows that the data contain the two levels "M" and "F". If these are the only levels that you want to report, you can use the COMPLETETYPES option to ensure that the output contains six rows, one for each joint combination of the Affiliation and Gender variables:
/* to get the joint levels that were not observed, you can use the COMPLETETYPES option. This output is suitable for putting into an (r x c) table */ proc means data=Survey maxdec=2 N Mean Min Max COMPLETETYPES; class Affiliation Gender; var Age; run; |
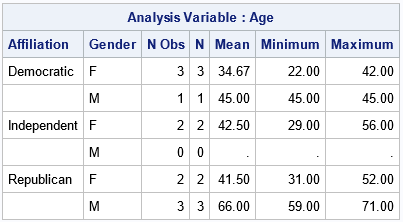
By using the COMPLETETYPES option, the table contains a row for "Independent males," even though that combination was not observed.
Summary
This article discusses how to include information about unobserved categories in the output from a SAS procedure.
- A general technique is to create a separate data set that contains all class levels that you want in your report. You can then concatenate that data set with the real data and analyze the concatenated data.
- PROC MEANS supports the CLASSDATA= option. You can use the CLASSDATA= option to specify a separate data set that contains all class levels that you want in your report.
- PROC MEANS supports the COMPLETETYPES option. If the CLASS variables in the observed data contain all the levels of interest, then you can use the COMPLETETYPES option to ensure that the output contains all joint levels of the CLASS variables, even if some joint levels are unobserved.

2 Comments
Hi Rick,
This is my first time seeing ndec used to control decimals places in proc means. I've only used maxdec and a quick google search did not yield results on ndec. I'm curious as to what the difference is between the two and when is it preferred to use one versus the other.
There is no difference. NDEC= is an alias for the MAXDEC= option. I didn't realize that it was undocumented. Sorry for the confusion. I will change the examples to use the MAXDEC= option. Thnks.