Recently, I saw a scatter plot that displayed the ticks, values, and labels for a vertical axis on the right side of a graph. In the SGPLOT procedure in SAS, you can use the Y2AXIS option to move an axis on the right side of a graph. Similarly, you can use the X2AXIS option to display a horizontal axis on the top of a plot.
But what if you want an axis on both the left and the right? (Or both the top and bottom!) This can be useful when your graph is very wide or tall.
In SAS, one way to create two axes is to duplicate the primary plot, but make the second plot invisible! Using an invisible plot to generate a second axis is an extremely useful SAS tip for creating statistical graphics. This trick was used countless times by Warren Kuhfeld to create innovative graphs. It was Warren who emphasized to me how valuable it can be to create an invisible plot.
When you create the invisible plot, you should use the Y2AXIS or X2AXIS option to specify which axis you are adding. There are two ways to create an invisible plot:
- For plots that display markers (such as a scatter plot), you can set the size of the markers to zero by using the option MARKERATTRS=(SIZE=0). Similarly, you can make lines invisible by using the LINEATTRS=(THICKNESS=0) option.
- Many plots that display areas (such as a bar chart), have options such as NOFILL and NOOUTLINE that you can use to make cells invisible.
- Almost every plot supports the TRANSPARENCY=1 option, which makes the plot completely transparent.
This article demonstrates how to use the invisible plot trick to create a second axis on the right for a scatter plot. A second example shows how to display duplicate axes for a bar chart.
Switch the axis location
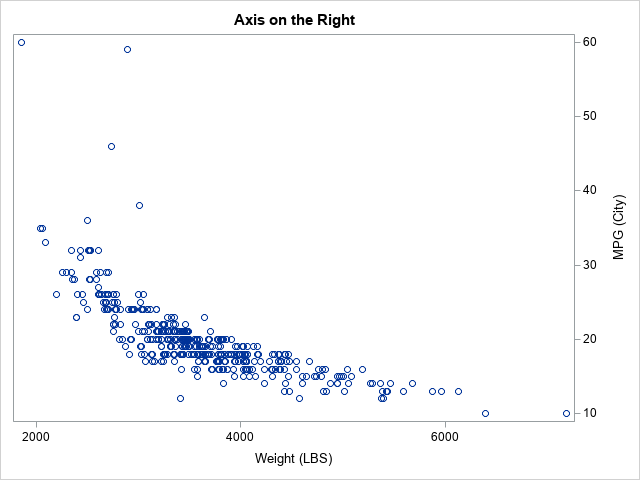
By default, the vertical axis is on the left (the Y axis) and the horizontal axis is at the bottom (the X axis). You can use the Y2AXIS option and the X2AXIS options to switch the location of the axis. For example, the following statements create a scatter plot that has the axis on the right side:
title "Axis on the Right"; proc sgplot data=sashelp.cars; scatter x=Weight y=MPG_City / y2axis; /* move the axis to the right */ run; |
Display two vertical axes
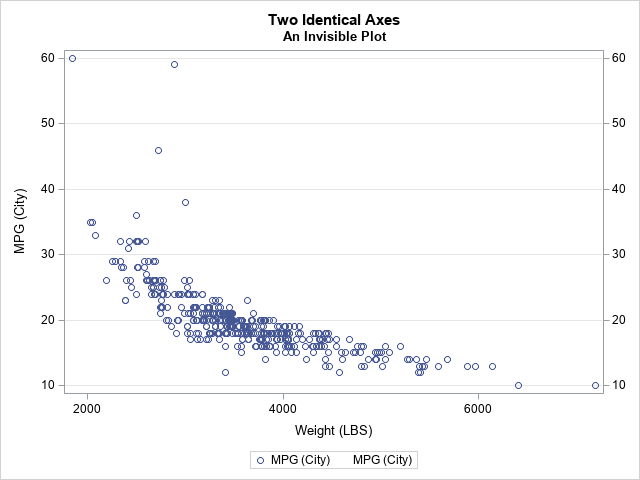
To display two axes, create the graph as usual, which will add a vertical axis on the left. You can use the YAXIS statement to control the attributes of the vertical axis. If you want to also display a copy of the axis on the right, create an invisible plot. For the scatter plot, and easy way to get an invisible plot is to set MARKERATTRS(SIZE=0)), as below. However, you could also use the TRANSPARENCY=1 option.
title "Two Identical Axes"; title2 "An Invisible Plot"; proc sgplot data=sashelp.cars; scatter x=Weight y=MPG_City; /* axis on the left */ yaxis grid; scatter x=Weight y=MPG_City / markerattrs=(size=0) y2axis; /* invisible plot; axis on the right */ y2axis display=(nolabel); /* optional: suppress label and/or values */ run; |
Display four axes
If you create an invisible plot that is associate with both the X2 axis and the Y2 axis, you can display four axes. The following horizontal bar chart is tall, so it is useful to have axes at the top and the bottom. Some of the bars are short and some are long, so it is helpful to have the categories displayed at the left and right. So that the visible and invisible plots have the same attributes, I like to define a macro variable that specifies the options, as follows:
ods graphics / width=400px height=600px; title "A Bar Chart with Two Sets of Axes"; %let opt = response=Weight categoryorder=respasc; proc sgplot data=sashelp.class noautolegend; hbar name / &opt; /* axis on the bottom and left */ xaxis grid label="Weight"; yaxis grid display=(nolabel); /* invisible plot puts axis on the top and right */ hbar name / &opt x2axis y2axis transparency=1; x2axis display=(nolabel); y2axis display=(nolabel); run; |

Summary
This article provides examples that show how to use the X2AXIS and Y2AXIS options to control the location of horizontal and vertical axes, respectively. To display an identical set of axes on both sides of a graph, create an invisible plot and associate it with the X2 or Y2 axis.
