Some hearts are famous. For example, there is the "Heart of Gold" (Neil Young), the "Heart of Glass" (Blondie), and the Heart of Darkness (Joseph Conrad). But have you heard of the "Heart of Ellipses"? No? Well, in 2023, Ted Conway published an amusingly titled article, "Total Ellipse of the Heart," in which he showed how you can construct a heart-shaped region from two ellipses. Conway saw the idea in an article by Amanda Newton ("The Heart of Mathematics") which provides the mathematical formulas.
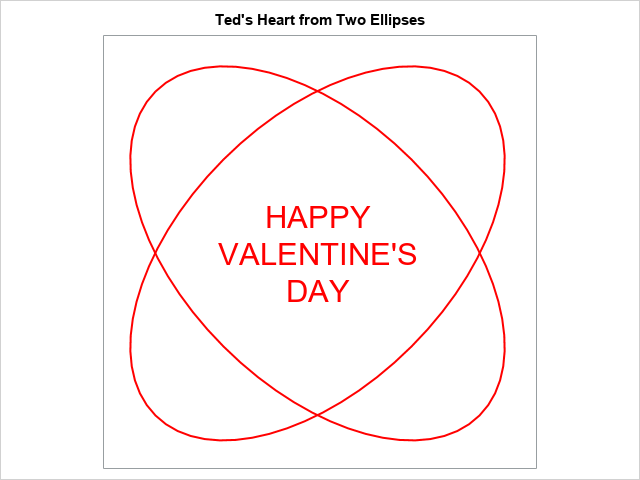
The image to the right is a slight modification of the image in Conway's post. Can you see the heart-shaped region? It was initially difficult for to see the heart-shaped region because two "lobes" of the ellipses are not part of the heart shape. Someone asked me whether it is possible to "erase" the parts of the ellipses that are not needed for the heart-shaped region. I replied that the best way to accomplish that task is to use a parametric form of the ellipses to parameterize the boundary of the heart-shaped region. You can then use the POLYGON statement in PROC SGPLOT to draw only the heart-shaped region. This article provides the details and shows an improved version of the "Heart of Ellipses."
Deriving the polar equation of an ellipse
The equation of the ellipse in Amanda Newton's article is
x2 + y2 - x*y = 1
There are several ways to parameterize this ellipse, but I will use polar coordinates.
You can convert this equation into polar coordinates by using the equations x = r*cos(θ) and y = r*sin(θ).
Plugging in those identities and simplifying gives the polar equation r2(1 - sin(θ)cos(θ))=1. You can simplify the equation further by using the trig identity 2*sin(θ)cos(θ) = sin(2θ).
Thus, a polar equation for the slanted ellipse is
r2 = 1 / (1 - (1/2)sin(2θ))
where 0 ≤ θ < 2 π.
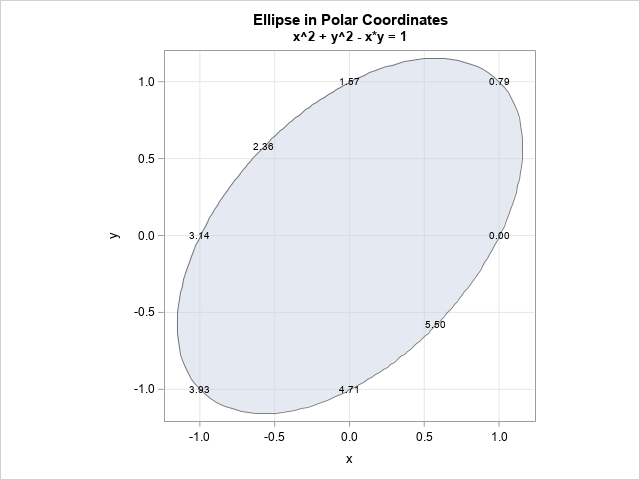
The following SAS DATA step parameterizes the ellipse and visualizes it by using the POLYGON statement in PROC SGPLOT. In addition, I add labels on the boundary of the ellipse that show a few values of the theta parameter:
/* draw a slanted ellipse x^2 + y^2 - x*y = 1 in polar coordinates, which is r^2 = 1 / (1 - (1/2)sin(2*theta)) */ data Ellipse; length label $4; ID = 1; /* ID var for POLYGON plot */ pi = constant('pi'); do theta = 0 to 2*pi by pi/100; r = sqrt(1 / (1 - 0.5*sin(2*theta))); x = r*cos(theta); y = r*sin(theta); /* plot in Cartesian coords */ output; end; /* add labels for a few values of theta */ do theta = 0 to 2*pi-0.1 by pi/4; r = sqrt(1 / (1 - 0.5*sin(2*theta))); xx = r*cos(theta); yy = r*sin(theta); label = putn(theta, 4.2); output; end; drop pi; run; title "Ellipse in Polar Coordinates"; title2 "x^2 + y^2 - x*y = 1"; proc sgplot data=Ellipse aspect=1 noautolegend; polygon x=x y=y ID=ID / fill outline transparency=0.5; text x=xx y=yy text=label; xaxis grid; yaxis grid; run; |
The half ellipse
The heart-shaped region in Conway's post is formed by using this ellipse and its reflection across the Y axis. To visualize what this looks like, let's draw only the portion of the ellipse for which x ≥ 0. You can show that this half-ellipse is parameterized by using 0 ≤ θ ≤ π/2 and 3π/2 ≤ θ < 2π. The following graph uses a WHERE statement to display only the right half of the ellipse:
%let pi = 3.1415926536; title "Half-Ellipse"; title2 "-pi/2 <= theta <= pi/2"; proc sgplot data=Ellipse aspect=2 noautolegend; where theta <= &pi/2 OR theta >= 3*&pi/2-0.001; polygon x=x y=y ID=ID / fill; text x=xx y=yy text=label; xaxis grid; yaxis grid; run; |
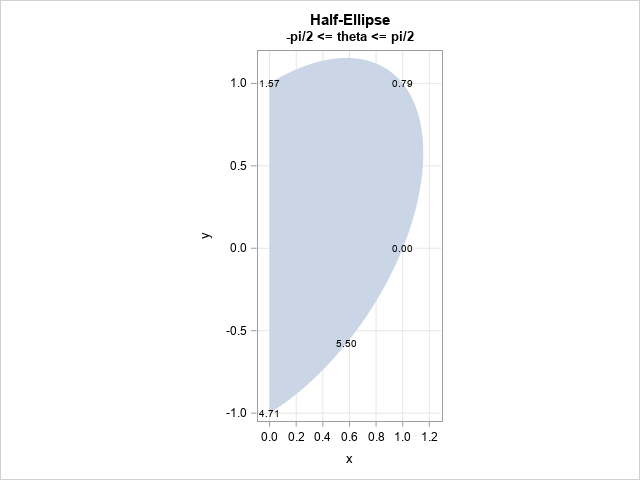
Ah! The heart shape is now apparent! To get the complete heart, we need to:
- Duplicate this image on the left side of the x axis.
- Sort the points so that you can traverse the heart shape in the correct order.
The complete parameterization of the elliptical heart
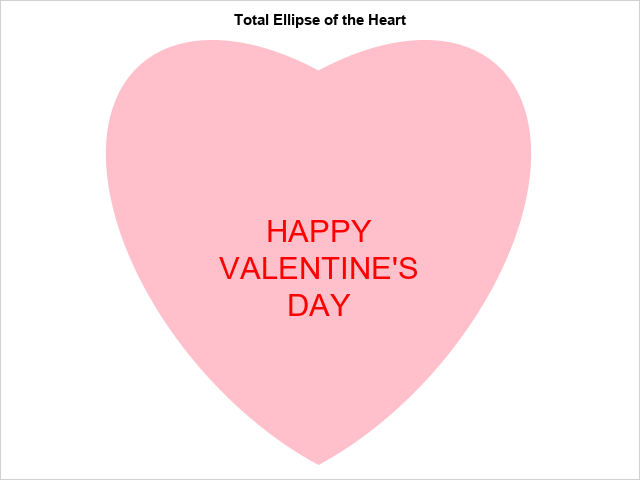
For each (x,y) pair in the previous image, we also want to include the point (-x,y). However, the value (-x,y) is associated with the polar angle π-θ, where θ is the polar angle for (x,y), so we must adjust the value of the parameter. The following DATA step reflects the (x,y) pairs, adjusts the polar angle, and sorts the data by the polar angle. It then plots the resulting polygon. Also, let's display the figure by using Valentine's Day colors such as pink and red and also overlay a greeting:
data Heart; retain ID 1; pi = constant('pi'); do t = -pi/2 to pi/2 by pi/100; r = sqrt(1 / (1 - 0.5*sin(2*t))); y = r*sin(t); /* for this value of y, save both x and -x */ theta = t; x = r*cos(theta); output; /* right half of heart */ theta = pi - t; x = -x; output; /* left half of heart */ end; run; proc sort data=Heart; by theta; /* reorder to get parameterized heart */ run; data textOnly; /* message from tc's post */ retain tx ty 0 msg "HAPPY/VALENTINE'S/DAY"; run; data All; set textOnly Heart; run; title "Total Ellipse of the Heart"; proc sgplot data=All noborder nowall noautolegend aspect=1; polygon x=x y=y ID=ID / fill fillattrs=(color=pink); text x=tx y=ty text=msg / textattrs=(size=22pt color=red) splitchar='/' splitpolicy=splitalways contributeoffsets=none; xaxis display=none; yaxis display=none; run; |
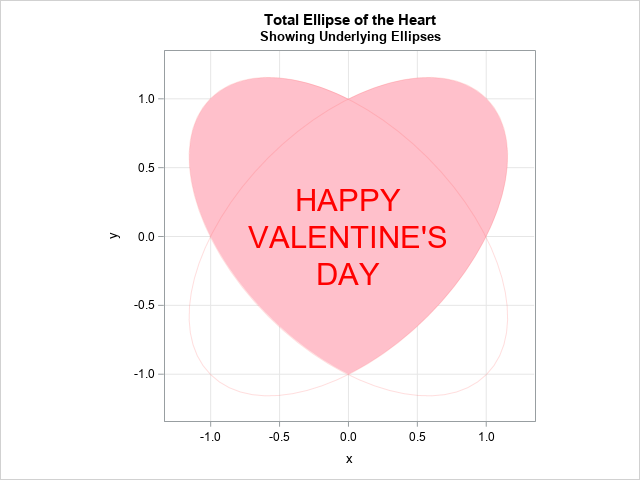
Overlaying the ellipses
One possible criticism of the previous image is that the ellipses are no longer apparent, so the title might by mysterious. If you want, you can overlay the ellipses in a very light color, as shown below. This image shows the relationship between the two ellipses in Conway's post and the heart-shaped region in the previous section.
Summary
If you overlay two diagonally oriented ellipses, the union of the ellipses contains a heart-shaped region in its interior. However, it isn't simple to see the heart-shaped region because some of the elliptical arcs are extraneous and obstruct the image. One way to resolve this issue is to parameterize the ellipses and use the parameterization to parameterize the heart-shaped region. The resulting image is clearly heart-shaped and aesthetically pleasing.
Long-time SAS programmers might know that there is a long history of using SAS to create Valentine's Day artwork, and even to propose marriage! For some previous efforts, see Chris Hemedinger's compilation post from 2018.
In the interest of brevity, I omitted the SAS code for some of the graphs. You can download the complete SAS program that creates the images in this article.

6 Comments
Good one Rick, keep it up
Great article. Now I don't have to buy my wife flowers for valentine's day.
You had me at "to use a parametric form of the ellipses to parameterize the boundary of the heart-shaped region." ❤️🤓
Oh, Michelle, you are such a romantic!
There are other parameterizations of heart-shaped regions. Here's one from 2011: https://blogs.sas.com/content/iml/2011/02/14/a-parametric-view-of-love.html
L❤️VE it! I enjoy your Valentine's Day posts each year. All so loveable geeky.
Pingback: 12 blog posts from 2024 that deserve a second look - The DO Loop