Statistical software often includes supports for a weight variable. Many SAS procedures make a distinction between integer frequencies and more general "importance weights." Frequencies are supported by using the FREQ statement in SAS procedures; general weights are supported by using the WEIGHT statement. An exception is PROC FREQ, which contains only a WEIGHT statement that is used for both cases.
I have previously explained that frequencies and weights are handled differently because frequencies change the sample size, whereas weights do not. A lot of inferential statistics (for examples, standard errors, confidence limits, and hypothesis tests) use the sample size in a calculation. When you use a frequency variable, the sample size increases. Consequently, standard errors decrease. When you use a weight variable, the sample size does not change. The standard errors depend on the weighted mean and weighted variance, so you cannot easily predict how the standard errors will change.
Interestingly, for many statistics, the formula for the point estimate is exactly the same for frequencies as for weights, which adds to the confusion between these two concepts. My previous article showed this fact by constructing two regression models that have the same point estimates. One model uses frequencies; the other uses weights.
This article uses the Pearson correlation to create a second example. The article uses PROC CORR in SAS to estimate two correlation statistics, one that uses frequencies and another that uses the frequencies as weights. You will see that the correlation estimate is the same, but standard errors, p-values, and other inferential statistics are different.
Frequency-weighted data
In a previous article about polychoric correlation, I used PROC FREQ to estimate the association between two Likert-scale ordinal variables that have integer values 1, 2, 3, .... The data for the analysis contained 12 rows and two variables, but the data also contains a frequency variable. By using the frequency variable, the 12 rows represent 2,000 observations. The PROC FREQ analysis shows many measures of association, including the Pearson correlation, which is usually reserved for continuous (not ordinal) variables.
Let's reproduce the data and run PROC CORR on the data. The correct way to analyze these data is to use the FREQ statement to tell the procedure that the data set represents 2,000 observations, as follows:
data Agree; input Quality Performance Count @@; label Quality="Quality Course?" Performance="Performance on Tests"; datalines; 1 1 131 1 2 71 1 3 20 2 1 217 2 2 207 2 3 112 3 1 213 3 2 337 3 3 257 4 1 52 4 2 139 4 3 244 ; title "Correlation Analysis"; title2 "Frequency Data Analyzed Correctly"; proc corr data=Agree Pearson fisher; var Quality Performance; freq Count; /* CORRECT: Use a FREQ stmt for counts */ run; |
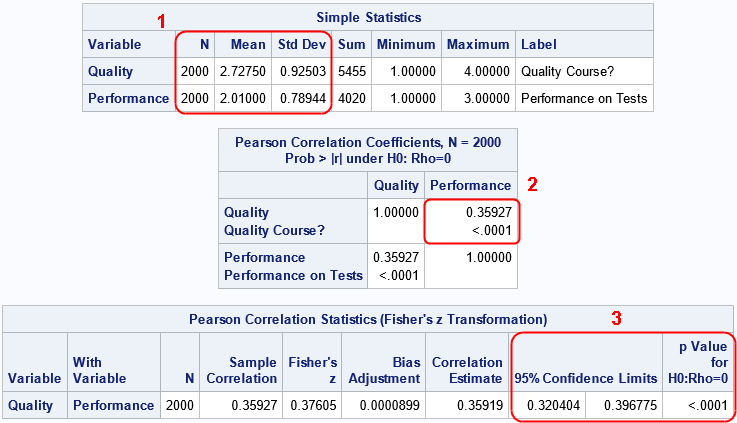
The estimate of the Pearson correlation for these two variables is about 0.3593. This is the same value reported by PROC FREQ in a previous analysis.
An incorrect analysis: Treating counts as weights
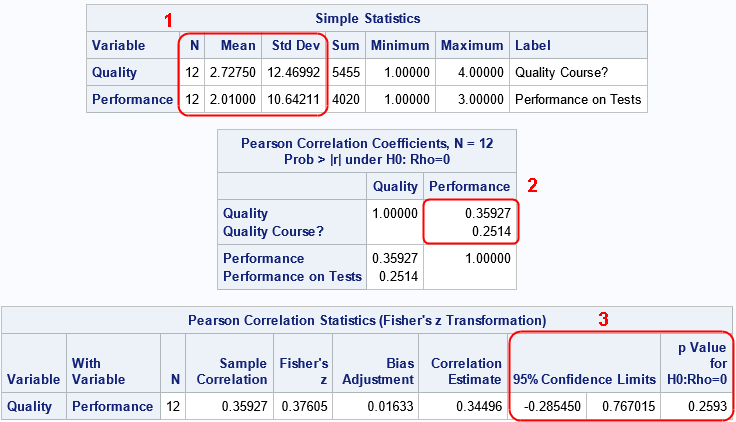
The previous section shows the correct way to handle frequency counts in PROC CORR. Namely, use the FREQ statement. It is wrong to use a WEIGHT statement. A weight statement tells the procedure that there are 12 observations in the data, but that you want to specify that some observations contribute more the problem than others. Let's run the incorrect analysis and compare the results:
title2 "Frequency Data Analyzed as Weights"; proc corr data=Agree Pearson fisher; var Quality Performance; weight Count; /* WRONG: Do not use a WEIGHT statement for counts */ run; |
Notice the following similarities and differences in the output:
- In the "Simple Statistics" table, the sample size is different. If you use the FREQ statement, the procedure correctly treats the data as containing 2,000 observations. If you use the WEIGHT statement, the procedure thinks there are 12 observations. In both cases, the sample means are the same, but the estimates for the standard deviation (which rely on the sample size) are very different.
- In the "Pearson Correlation Coefficients" table, the estimates for the correlation are the same, but the p-values (which uses the standard error of the data) are different.
- In the "Pearson Correlation Statistics" table, the estimates for the correlation are the same, but the confidence intervals are different.
In summary, frequencies and weights often produce the same point estimates, but different estimates for the sample size and for the variance in the data. Consequently, statistics that use the sample size or the variance will be different.
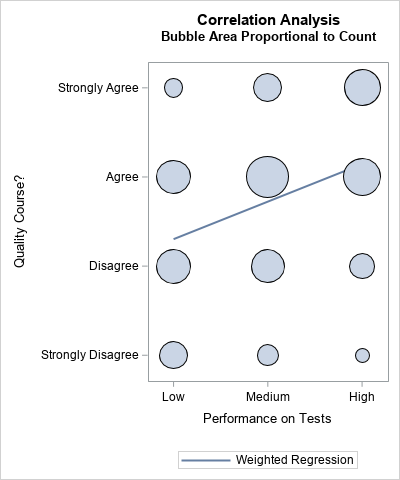
You can draw a graph that uses a bubble plot to show the weighted observations. (See the article, "Visualize a weighted regression," for an explanation.) Because the correlation coefficient between two variables equals the slope of the regression line of the standardized variables, I add a regression line to demonstrate that the variables appear to have a small, positive, weighted correlation.
A manual computation of a frequency (or weighted) statistic
The documentation for PROC CORR includes a formula for the weighted Pearson correlation between two variables X and Y:
\(
r_{xy}=\frac{\sum _ i \, w_ i(x_ i-\bar{x}_ w)(y_ i-\bar{y}_ w)}{\sqrt{\sum _ i w_ i(x_ i-\bar{x}_ w)^2 \, \sum _ i w_ i(y_ i-\bar{y}_ w)^2}}
\)
where \(w_i\) is the weight of the i_th observation, \(\bar{x}_ w\) is the weighted mean of x, and \(\bar{y}_ w\) is the weighted mean of y.
As we've seen in the previous sections, you get the same point estimate whether
\(w_i\) is a weight or a frequency count.
The following SAS IML program reads the data and frequencies for the Agree data that were analyzed earlier.
The program computes the weighted means and the weighted variances. I deviate from the formula in two ways. First, I standardize the weights so that they sum to unity. This is not necessary but is convenient. Second, I vectorize the computation by multiplying each element of the centered data by \(\sqrt{w_i}\). Geometrically, this transforms the unweighted data vectors into weighted vectors in a way that simplifies the analysis.
proc iml; /* A SAS IML implementation of weighted correlation betwen Y1 and Y2 */ start PearsonCorrWt(Y1, Y2, Wt); W = Wt / sum(Wt); /* standardize the weights */ wMean1 = W`*Y1; /* computed the weighted means */ wMean2 = W`*Y2; C1 = Y1 - wMean1; /* center the variables */ C2 = Y2 - wMean2; X1 = sqrt(W)#C1; /* transform the centered variables by sqrt(W) */ X2 = sqrt(W)#C2; wCorr = X1`*X2 / (norm(X1)*norm(X2)); /* formula for weighted correlation */ return wCorr; finish; /* test the function */ use Agree; read all var 'Quality' into Y1; read all var 'Performance' into Y2; read all var 'Count' into M; close; wCorr = PearsonCorrWt(Y1, Y2, M); print wCorr; |

The "manual" computation of the weighted correlation in SAS IML is the same as the point estimate from PROC CORR.
Summary
This article shows another example that demonstrates that weights are not the same as frequencies. Although a weight variable and a frequency variable often produce the same point estimate, the two analyses differ in how they estimate the sample size and the variance of the estimator. This article also shows how to use the SAS IML language to reproduce an estimate for a weighted Pearson correlation. The same function can be used whether the weight variable represents frequencies or importance weights.
Although this example shows a weighted analysis for the Pearson correlation statistic, the same ideas apply to other statistics.

2 Comments
Rick,
"This article uses the Pearson correlation to create a second example."
"I used PROC FREQ to estimate the association between two Likert-scale ordinal variables"
What difference between correlation and association you mentioned in this blog?
In documentation, PROC CORR refer to it by correlation ,whle PROC FREQ refer to it by association .
Was the difference is just between continuous variable and category variable ?
Yes. The word "correlation" typically means a relationship between two continuous numeric variables. The word "association" is more general. It can refer to relationships between discrete (including character) variables. So all correlations are associations, but not all associations are correlations. Notice that PROC CORR only handles numeric variables, whereas PROC FREQ can handle any kind of discrete variable.