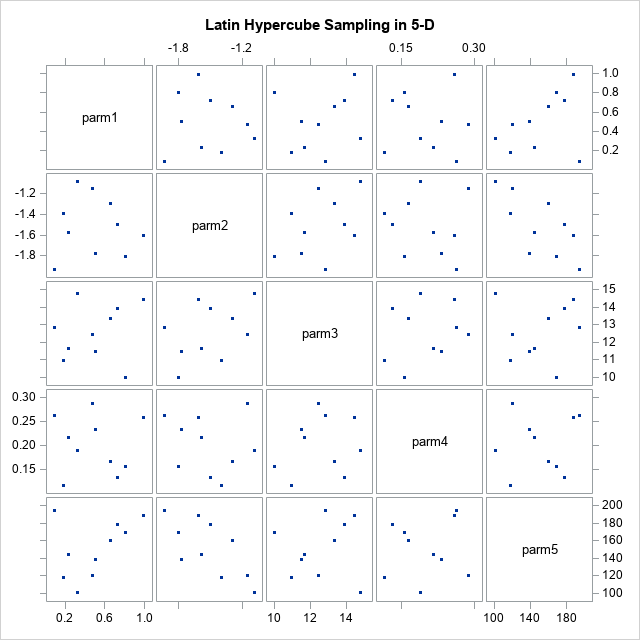
Is 4 an extreme value for the standard normal distribution? In high school, students learn the famous 68-95-99.7 rule, which is a way to remember that 99.7 percent of random observation from a normal distribution are within three standard deviations from the mean. For the standard normal distribution, the probability
Tag: Simulation
Recently I wrote about how to compute the Kolmogorov D statistic, which is used to determine whether a sample has a particular distribution. One of the beautiful facts about modern computational statistics is that if you can compute a statistic, you can use simulation to estimate the sampling distribution of
Here's a simulation tip: When you simulate a fixed-effect generalized linear regression model, don't add a random normal error to the linear predictor. Only the response variable should be random. This tip applies to models that apply a link function to a linear predictor, including logistic regression, Poisson regression, and
Did you know that SAS provides built-in support for working with probability distributions that are finite mixtures of normal distributions? This article shows examples of using the "NormalMix" distribution in SAS and describes a trick that enables you to easily work with distributions that have many components. As with all
In simulation studies, sometimes you need to simulate outliers. For example, in a simulation study of regression techniques, you might want to generate outliers in the explanatory variables to see how the technique handles high-leverage points. This article shows how to generate outliers in multivariate normal data that are a
This article shows how to use SAS to simulate data that fits a linear regression model that has categorical regressors (also called explanatory or CLASS variables). Simulating data is a useful skill for both researchers and statistical programmers. You can use simulation for answering research questions, but you can also
It is sometimes necessary for researchers to simulate data with thousands of variables. It is easy to simulate thousands of uncorrelated variables, but more difficult to simulate thousands of correlated variables. For that, you can generate a correlation matrix that has special properties, such as a Toeplitz matrix or a
In a previous article, I showed how to find the intersection (if it exists) between two line segments in the plane. There are some fun problems in probability theory that involve intersections of line segments. One is "What is the probability that two randomly chosen chords of a circle intersect?"
My 2018 SAS Global Forum paper was about "how to use the random-number generators (RNGs) in SAS." You can read the paper for details, but I recently recorded a short video that summarizes the main ideas in the paper. In particular, the video gives an overview of the new RNGs
The SURVEYSELECT procedure in SAS 9.4M5 supports the OUTRANDOM option, which causes the selected items in a simple random sample to be randomly permuted after they are selected. This article describes several statistical tasks that benefit from this option, including simulating card games, randomly permuting observations in a DATA step,
In a previous blog post, I discussed ways to produce statistically independent samples from a random number generator (RNG). The best way is to generate all samples from one stream. However, if your program uses two or more SAS DATA steps to simulate the data, you cannot use the same
Simulation studies require both randomness and reproducibility, two qualities that are sometimes at odds with each other. A Monte Carlo simulation might need to generate millions of random samples, where each sample contains dozens of continuous variables and many thousands of observations. In simulation studies, the researcher wants each sample
A colleague and I recently discussed how to generate random permutations without encountering duplicates. Given a set of n items, there are n! permutations My colleague wants to generate k unique permutations at random from among the total of n!. Said differently, he wants to sample without replacement from the
Simulation studies are used for many purposes, one of which is to examine how distributional assumptions affect the coverage probability of a confidence interval. This article describes the "zipper plot," which enables you to compare the coverage probability of a confidence interval when the data do or do not follow
If N random people are in a room, the classical birthday problem provides the probability that at least two people share a birthday. The birthday problem does not consider how many birthdays are in common. However, a generalization (sometimes called the Multiple-Birthday Problem) examines the distribution of the number of
This article simulates the birthday-matching problem in SAS. The birthday-matching problem (also called the birthday problem or birthday paradox) answers the following question: "if there are N people in a room, what is the probability that at least two people share a birthday?" The birthday problem is famous because the
What is a random number generator? What are the random-number generators in SAS, and how can you use them to generate random numbers from probability distributions? In SAS 9.4M5, you can use the STREAMINIT function to select from eight random-number generators (RNGs), including five new RNGs. After choosing an RNG,
Last week I got the following message: Dear Rick: How can I create a normal distribution within a specified range (min and max)? I need to simulate a normal distribution that fits within a specified range. I realize that a normal distribution is by definition infinite... Are there any alternatives,
This article shows how to simulate beta-binomial data in SAS and how to compute the density function (PDF). The beta-binomial distribution is a discrete compound distribution. The "binomial" part of the name means that the discrete random variable X follows a binomial distribution with parameters N (number of trials) and
„… Internet, Internet, ich hör‘ hier immer Internet. Sag’n Se‘ ma‘, ganz richtig ist das nicht!“ Der Service-Manager errötet nach seinem Rap. Lenin schwankt zwischen Belustigung und bolschewistischem Ingrimm: Stellt der Rote Rapper seine Erfolge im Internet of Things infrage? Der Rapper fährt fort: „Denn diese Daten, die Sie verbraten,
The article "Fisher's transformation of the correlation coefficient" featured a Monte Carlo simulation that generated sample correlations from bivariate normal data. The simulation used three steps: Simulate B samples of size N from a bivariate normal distribution with correlation ρ. Use PROC CORR to compute the sample correlation matrix for
In a large simulation study, it can be convenient to have a "control file" that contains the parameters for the study. My recent article about how to simulate multivariate normal clusters demonstrates a simple example of this technique. The simulation in that article uses an input data set that contains
My article about Fisher's transformation of the Pearson correlation contained a simulation. The simulation uses the RANDNORMAL function in SAS/IML software to simulate multivariate normal data. If you are a SAS programmer who does not have access to SAS/IML software, you can use the SIMNORMAL procedure in SAS/STAT software to
This article shows how to simulate data from a mixture of multivariate normal distributions, which is also called a Gaussian mixture. You can use this simulation to generate clustered data. The adjacent graph shows three clusters, each simulated from a four-dimensional normal distribution. Each cluster has its own within-cluster covariance,
A classical problem in elementary probability asks for the expected lengths of line segments that result from randomly selecting k points along a segment of unit length. It is both fun and instructive to simulate such problems. This article uses simulation in the SAS/IML language to estimate solutions to the
If you toss a coin 28 times, you would not be surprised to see three heads in a row, such as ...THHHTH.... But what about eight heads in a row? Would a sequence such as THHHHHHHHTH... be a rare event? This question popped into my head last weekend as I
Last week I was asked a simple question: "How do I choose a seed for the random number functions in SAS?" The answer might surprise you: use any seed you like. Each seed of a well-designed random number generator is likely to give rise to a stream of random numbers,
A SAS customer asked how to simulate data from a three-parameter lognormal distribution as specified in the PROC UNIVARIATE documentation. In particular, he wanted to incorporate a threshold parameter into the simulation. Simulating lognormal data is easy if you remember an important fact: if X is lognormally distributed, then Y=log(X)
The 2017 edition of SAS Global Forum, the largest annual SAS user group meeting, will be held at the Swan and Dolphin Resort in Orlando, Florida on April 2-5. Among the many analytic talks at SAS Global Forum 2017, several focus on operations research topics like optimization and simulation. If
Monte Carlo techniques have many applications, but a primary application is to approximate the probability that some event occurs. The idea is to simulate data from the population and count the proportion of times that the event occurs in the simulated data. For continuous univariate distributions, the probability of an