In a large simulation study, it can be convenient to have a "control file" that contains the parameters for the study. My recent article about how to simulate multivariate normal clusters demonstrates a simple example of this technique. The simulation in that article uses an input data set that contains the parameters (mean, standard deviations, and correlations) for the simulation. A SAS procedure (PROC SIMNORMAL) simulates data based on the parameters in the input data set.
This is a powerful paradigm. Instead of hard-coding the parameters in the program (or as macro variables), the parameters are stored in a data set that is processed by the program. This is sometimes called data-driven programming. (Some people call it dynamic programming, but there is an optimization technique of the same name so I will use the term "data-driven.") In a data-driven program, when you want to run the program with new parameters, you merely modify the data set that contains the control parameters.
I have previously written about a different way to control a batch program by passing in parameters on the command line when you invoke the SAS program.
Static programming and hard-coded parameters
Before looking at data-driven programming, let's review the static approach. I will simulate clusters of univariate normal data as an example.
Suppose that you want to simulate normal data for three different groups. Each group has its own sample size (N), mean, and standard deviation. In my book Simulating Data with SAS (p. 206), I show how to simulate this sort of ANOVA design by using arrays, as follows.
/* Static simulation: Parameters embedded in the simulation program */ data AnovaStatic; /* define parameters for three simulated group */ array N[3] _temporary_ (50, 50, 50); /* sample sizes */ array Mean[3] _temporary_ (14.6, 42.6, 55.5); /* center for each group */ array StdDev[3] _temporary_ ( 1.7, 4.7, 5.5); /* spread for each group */ call streaminit(12345); do k = 1 to dim(N); /* for each group */ do i = 1 to N[k]; /* simulate N[k] observations */ x = rand("Normal", Mean[k], StdDev[k]); /* from k_th normal distribution */ output; end; end; run; |
The DATA step contains two loops, one for the groups and the other for the observations within each group. The parameters for each group are stored in arrays. Notice that if you want to change the parameters (including the number of groups), you need to edit the program. I call this method "static programming" because the behavior of the program is determined at the time that the program is written. This is a perfectly acceptable method for most applications. It has the advantage that you know exactly what the program will do by looking at the program.
Data-driven programming: Put parameters in a file
An alternative is to put the parameters for each group into a file or data set. If the k_th row in the data set contains the parameters for the k_th group, then the implicit loop in the DATA step will iterate over all groups, regardless of the number of groups. The following DATA step creates the parameters for three groups, which are read and processed by the second DATA step. The parameter values are the same as for the static example, but are transposed and processed row-by-row instead of via arrays:
/* Data-driven simulation: Parameters in a data set, processed by the simulation program */ data params; /* define parameters for each simulated group */ input N Mean StdDev; datalines; 50 14.6 1.7 50 42.6 4.7 50 55.5 5.5 ; data AnovaDynamic; call streaminit(12345); set params; /* implicit loop over groups k=1,2,... */ do i = 1 to N; /* simulate N[k] observations */ x = rand("Normal", Mean, StdDev); /* from k_th normal distribution */ output; end; run; |
Notice the difference between the static and dynamic techniques. The static technique simulates data from three groups whose parameters are specified in temporary arrays. The dynamic technique simulates data from an arbitrary number of groups. Currently, the PARAMS data specifies three groups, but if I change the PARAMS data set to represent 10 or 1000 groups, the AnovaDynamic DATA step will simulate data from the new design without any modification.
Generate the parameters from real data
The data-driven technique is useful when the parameters are themselves the results of an analysis. For example, a common simulation technique is to generate the moments of real data (mean, variance, skewness, and so forth) and to use those statistics in place of the population parameters that they estimate. (See Chapter 16, "Moment Matching," in Simulating Statistics with SAS.)
The following call to PROC MEANS generates the sample mean and standard deviation for real data and writes those values to a data set:
proc means data=sashelp.iris N Mean StdDev stackods; class Species; var PetalLength; ods output Summary=params; run; |
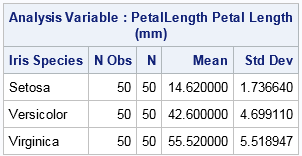
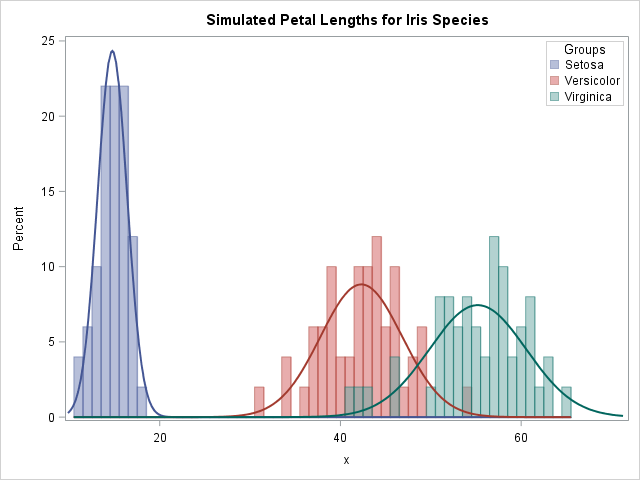
The output data set from PROC MEANS creates a PARAMS data set that contains the variables (N, MEAN, and STDDEV) that are read by the simulation program. Therefore, you can immediately run the AnovaDynamic DATA step to simulate normal data from the sample statistics. A visualization of the resulting simulated data is shown below.
You can run PROC MEANS on other data and other variables and the AnovaDynamic step will continue to work without any modification. The simulation is controlled entirely by the values in the "control file," which is the PARAMS data set.
You can generalize this technique by wrapping the program in a SAS macro in which the name of the parameter file and the name of the simulated data set are provided at run time. With a macro implementation, you can read from multiple input files and write to multiple output data sets. You could use such a macro, for example, to break up a large simulation study into smaller independent sub-simulations, each controlled by its own file of input parameters. In a gridded environment, each sub-simulation can be processed independently and in parallel, thus reducing the total time required to complete the study.
Although this article discusses control files in the context of statistical simulation, other applications are possible. Have you used a similar technique to control a program by using an input file that contains the parameters for the program? Leave a comment.

5 Comments
For me, I used data-driven code to split a table into several groups which has a special ratio.
e.x. the following divide the SASHELP.AIR into 5 groups which has the equal size.
note: the ratio in it can change dynamically ,as long as their sum equal 1.
data have;
set sashelp.air;
run;
%let dsid=%sysfunc(open(have));
%let nobs=%sysfunc(attrn(&dsid,nlobs));
%let dsid=%sysfunc(close(&dsid));
data group;
input ratio;
retain start 1;
cum_ratio+ratio;
end=int(cum_ratio*&nobs);
group+1;
do i=start to end;
output;
end;
start=end+1;
keep group;
cards;
0.2
0.2
0.2
0.2
0.2
;
run;
data want;
merge group have;
run;
proc freq data=want;
table group;
run;
nice article Rick!
"data driven from a control file" is also an effective solution beyond simulation problems. The term describes an operational solution for a team managing some financial data (daily liquidity monitoring for the next 500 days, that I implemented to use SAS and other desktop tools). As the operational users were not SAS programmers it was helpful that a range in excel could be treated in SAS as a table (of name-value pairs). There was enough parameter validation (in SAS) to promptly reject inappropriate or invalid values in the spreadsheet range. No new operational users needed the steep learning curve into SAS.
So a big thankyou to the "data driven" concept - and the ability of "SAS/ACCESS to pc files" to define an excel workbook as a data library.
Thanks for sharing, Peter. I agree: it is a powerful abstraction that enables programmers to isolate parameters from the program that uses them.
Nice article! I guess I should get your book, but meanwhile I wonder if it is possible to also capture correlations between the groups from the data and incorporate in the simulation to create dependencies between the groups?
Yes, there are many techniques for simulating correlated data. Topics that have appeared in my blog include multivariate normal data, multinomial data, clustered data, and so forth. My book discusses those and other simulation strategies.