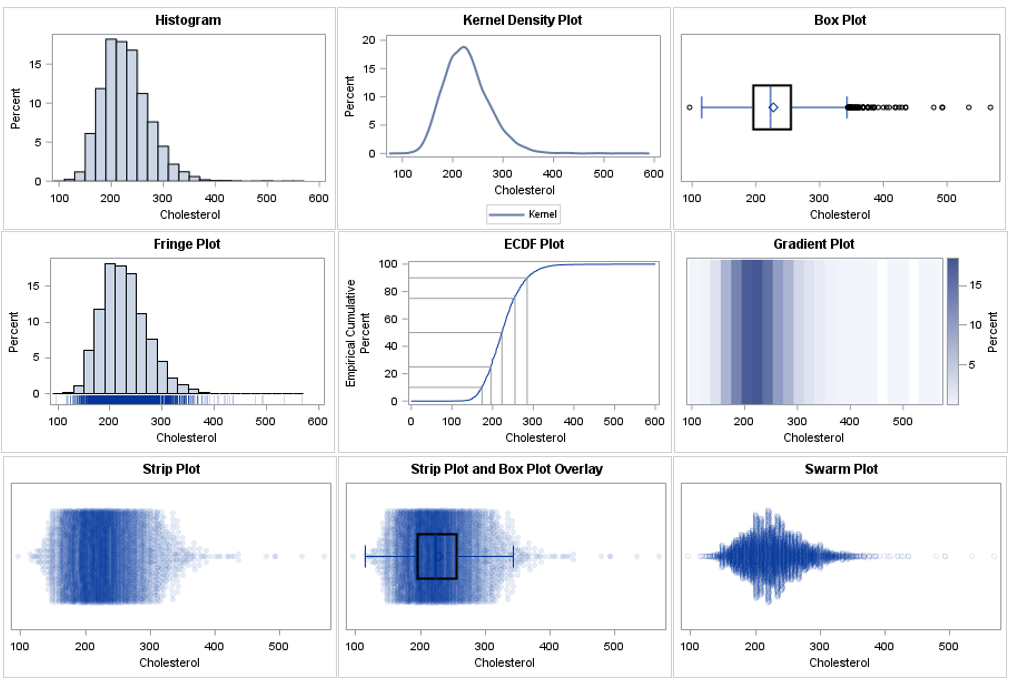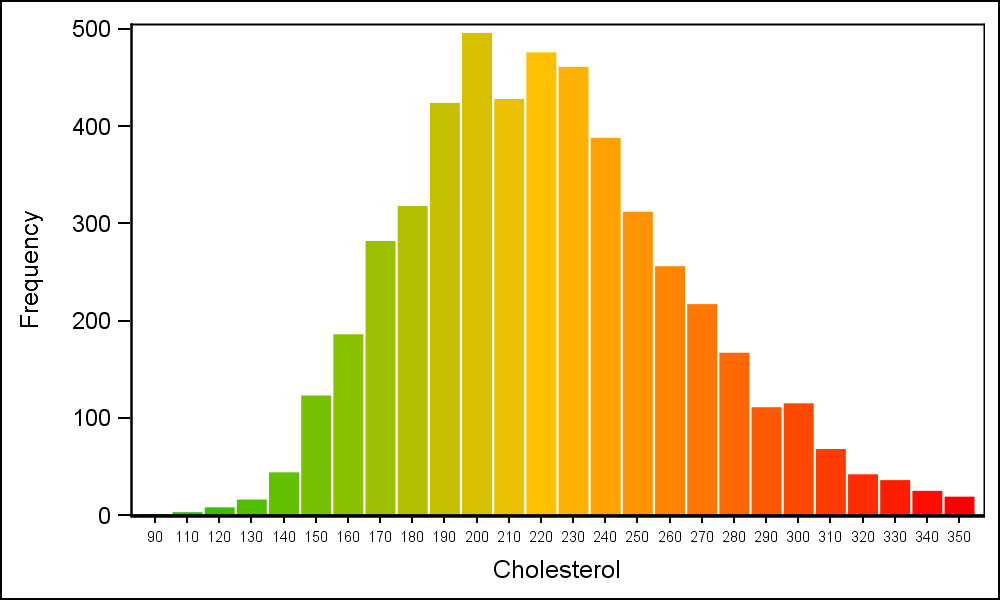
Histogram with Gradient Color

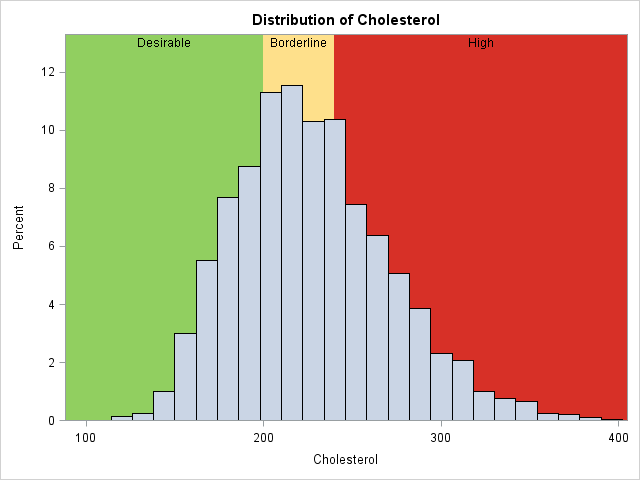
Recently a user posted a query on the SAS Communities page asking on how to create a histogram where the bins of the histogram are colored by the analysis variable using a three color ramp. Essentially, he wanted the bins to be colored from "Low" to "High" along the horizontal