
Computer vision applications are everywhere. At SAS alone, we have developed solutions in manufacturing, transportation, healthcare, and the retail sectors, just to name a few. In turn, concern for privacy, given the intrinsically sensitive nature of image data, has become more prevalent too. I will share some ideas for how to build computer vision solutions with privacy baked into their design. I will also explore the ideas of privacy-by-design with use cases for the retail sector. Hopefully, it will also be apparent how these concepts generalize to other domains.
Background
Consider this hypothetical situation. Imagine that you walked into a store 10 years ago and saw a camera. What assumptions would you make about how that video footage is being used? I would probably assume it is there mostly for security and maybe someone in a backroom is watching. I might also assume that given the expensive cost of storage, the data is retained for only a limited amount of time, if at all.
How would your assumptions differ today, given the rise of advanced “AI” computer vision algorithms and the powerful computing hardware that supports it? The potential use cases are too numerous to list and go far beyond security. Examples would be tracking, facial recognition, emotion analysis, learning preferences, or associations, and so on. In any case, how often are you told explicitly what kind of analytics are being performed? Or how your data will be stored, retained, or shared/transferred? Even if you knew all of that, are you given an option to opt-out? What is the default?
Legislation like the GDPR and the ideas laid out in “The 7 Foundational Principles of Privacy by Design” begins to address these issues. In particular, we want to ensure that the purpose of any data collection is explicit, collect and keep the minimal amount of data to solve a problem, provide informed consent, and provide measures so that privacy is the default setting.
Levels of privacy
Now, let me illustrate some specific analytic techniques that can provide different levels of privacy while aligning with the stated goals of a particular solution. Suppose we have a camera in a store. Our goal is to monitor people to understand where they spend more time. Or our goal could be to analyze how well people are maintaining social distancing. Each level of privacy might provide a certain degree of protection because it can eliminate some personally identifiable information and limit the scope of certain analytic capabilities (such as facial recognition, sentiment analysis, tracking, and so on). But it might still be collecting data that are more granular than a particular solution requires.
Levels 0 and 1
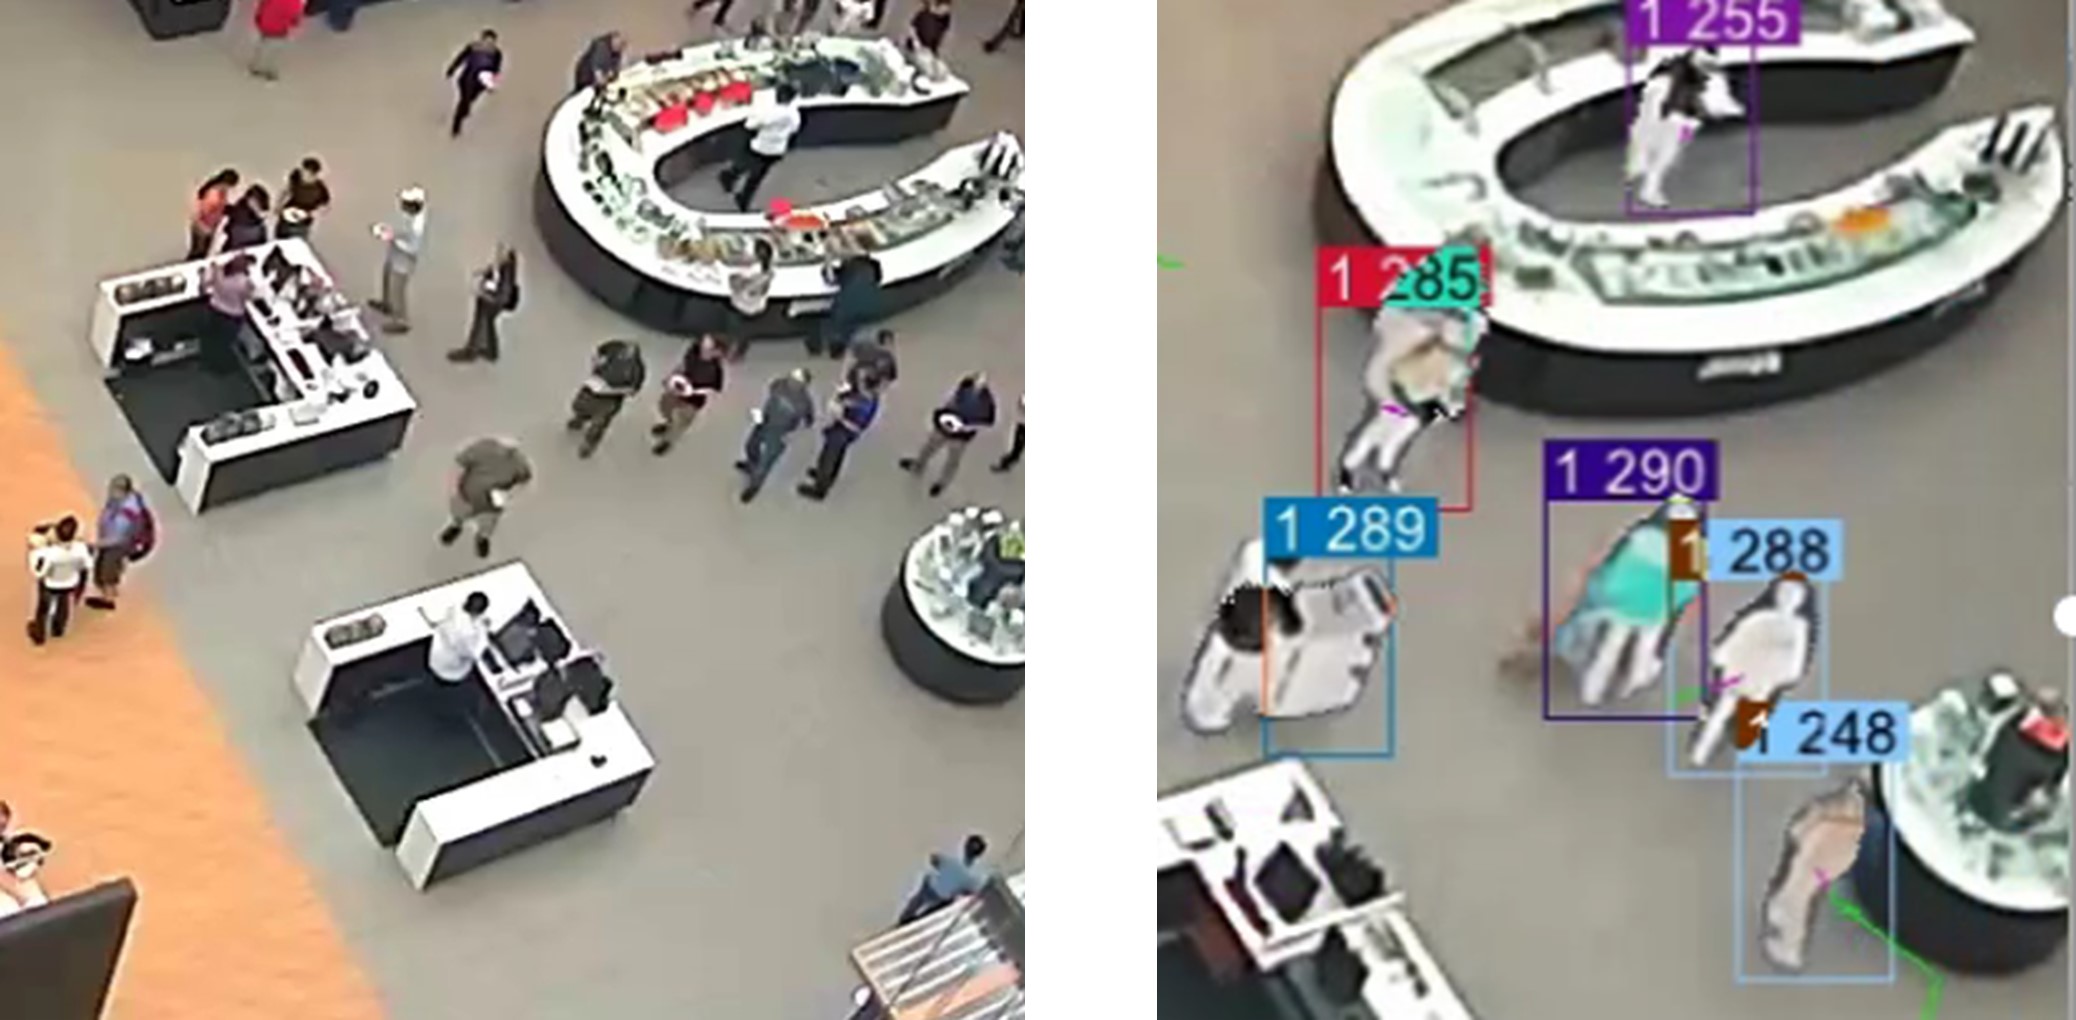
Level-0: This protection could involve having a camera of sufficiently low resolution. This might eliminate the possibility of facial recognition or eye-tracking, but individual people might still be identifiable (Figure 1, left).
Level-1: Apply pixel-level blurring or masking (Figure 1, right). If you use a segmentation model (for example, Unet), you can determine whether each pixel belongs to a face or person. Then you could choose to blur or mask each of those pixels. A slight extension to this idea would be to blur or mask an entire bounding box containing a face or a person. An example would be using an object-detection model such as a YOLO model. But certain size and shape information would still be present and could pose a risk. A person in a wheelchair or who has a guide dog would still be easily identifiable.
Level 2
Level-2: Keep just the centroid of each detected person (Figure 2). For the use cases mentioned above, this is usually sufficient. It might be the only data you need to propagate forward in your solution.
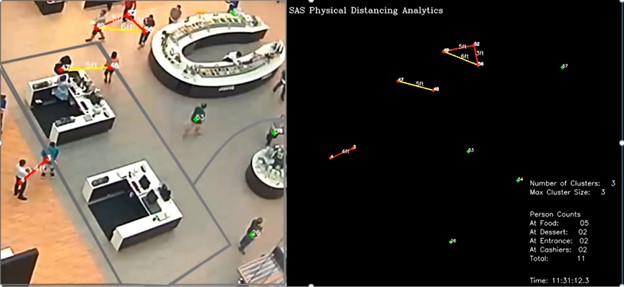
But the above levels still track people to a certain degree because there is still a centroid for each person. The next level will be to aggregate detected persons thereby eliminating information about any particular individual.
Level 3
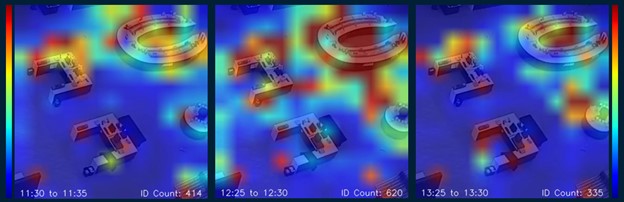
Level-3: Build dynamic heat maps (Figures 3 and 4). In a use case that seeks to identify which areas of a store are more frequently visited, a heat map is a natural choice. You can see in Figure 3 that no information is present about a single individual. However, the colors of the heat map provide relevant insights. We can even aggregate the information over 5-minute intervals and study the dynamics of how traffic patterns evolve. This type of information could be used to understand which aisles are visited more, whether a new display is attracting attention, which areas might need additional cleaning due to their higher traffic… or myriad other questions without ever tracking any single individual.
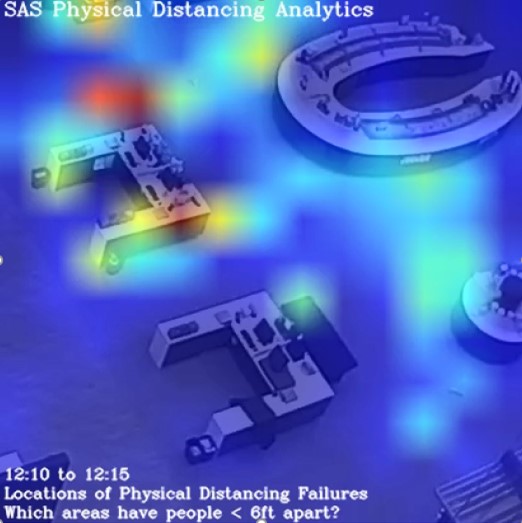
Another example of this comes from the use case of analyzing social distancing. Instead of keeping the data of which individuals were not social distancing, we can summarize a social distancing failure by recording the location of the incident. We can turn this into a heat map too and understand where the social distancing failures occur (Figure 4). Crucially, this shifts the focus of the analytics from who to where. The former enables a certain blame game to target individuals who failed to socially distance themselves. But perhaps there are certain bottlenecks in a space that make it difficult for people to be socially distant. A heat map can reveal this and provide guidance for how a space might need to be redesigned to better promote social distancing.
Summary
In use cases that don’t require individual tracking heat maps provide a much safer alternative that still manages to answer the relevant questions. If we were to deploy a social distancing solution on a real-time video feed, and we were only interested in the questions that are answered by the heat map, then this would inform us how much data needs to be retained at each stage of a solution pipeline. For example, most of the computations could be done at the edge, “near” the camera. This means that sensitive data does not even need to be retained for subsequent steps. This in turn reduces overall risk and simultaneously provides privacy and security.
Of course, not all use cases can be addressed with heat maps alone. But many levels of privacy could be implemented that align with the stated goals of a solution. If we choose to address these questions at the design stage of a project, we can provide the greatest privacy for any given solution. We can minimize data collection, define the right levels of access, and provide mechanisms for informed consent. In short, a robust solution with privacy by design.
Computationally, a heat map is just a 2D-histogram visualized with a colormap. More specifically, a 2D image is split into equal-sized 2D-bins. The counts in each bin are visualized with a color (instead of the height of a bar in a traditional 1D-histogram). But from an analytics perspective, a heat map is a powerful tool for simultaneously providing great insights with maximal privacy. In a subsequent blog post, we will share a high-performance method for computing heat maps using SAS.


3 Comments
Thanks for your excellent post. Do you have any recommended paper which contains a more in-depth explanation of level 3 method?
Thank you for your interest.
If you'd like to learn more about how we developed a physical distancing and crowd density monitoring solution using computer vision, please see the following paper:
https://www.iiconsortium.org/news/joi-articles/2020_November_JoI_Physical_Distancing_and_Crowd_Density_Monitoring_Using_Computer_Vision.pdf
The paper discusses in a little more detail the use of heatmaps in this context.
If you'd like to learn more about the computation of heatmaps in a fast way, please stay tuned for the next blog post written by a talented colleague of mine.
Pingback: High-performance calculation of heat maps using CAS - The SAS Data Science Blog