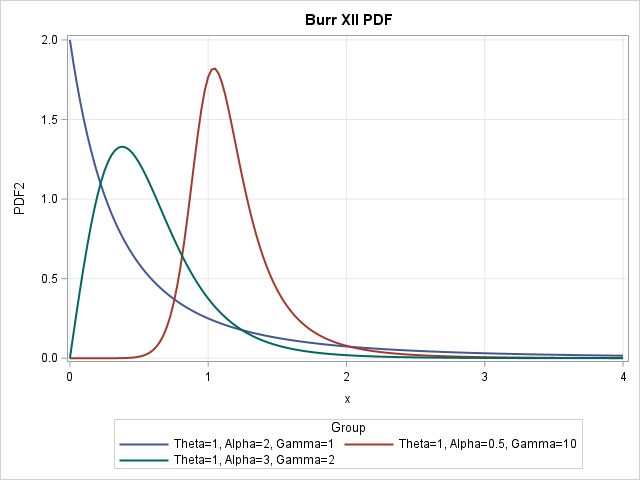
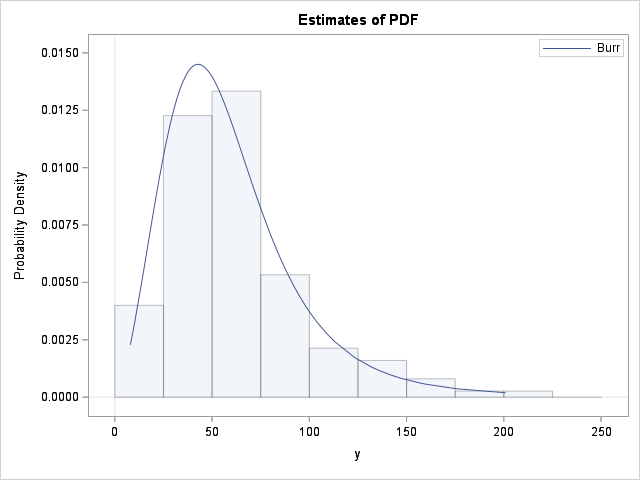
A previous article shows how to model the probabilities in a discrete-time Markov chain by using a Markov transition matrix. A Markov chain is a discrete-time stochastic process for which the current state of the system determines the probability of the next state. In this process, the probabilities for transitioning
Tag: Statistical Programming
Given a set of N points in k-dimensional space, can you find the location that minimizes the sum of the distances to the points? The location that minimizes the distances is called the geometric median of the points. For univariate data, the "points" are merely a set of numbers $${p_1,
Labeling objects in graphs can be difficult. SAS has a long history of providing support for labeling markers in scatter plots and for labeling regions on a map. This article discusses how the SGPLOT procedure decides where to put a label for a polygon. It discusses the advantages and disadvantages
SAS supports many ways to compute the rank of a numeric variable and to handle tied values. However, sometimes I need to rank the values in a character categorical variable. For example, the values {"Male", "Female", "Male"} have ranks {2, 1, 2} because, in alphabetical order, "Female" is the first-ranked
A previous article defines the silhouette statistic (Rousseeuw, 1987) and shows how to use it to identify observations in a cluster analysis that are potentially misclassified. The article provides many graphs, including the silhouette plot, which is a bar chart or histogram that displays the distribution of the silhouette statistic
A lot of programmers have been impressed by the ability of ChatGPT, GPT-4, and Bing Chat to write computer programs. Recently, I wrote an article that discusses an elementary programming assignment, called FizzBuzz, which is sometimes used as part of a hiring process to assess a candidate's basic knowledge of
The fundamental operations on sets are union, intersection, and set difference, all of which are supported directly in the SAS IML language. While studying another programming language, I noticed that the language supports an additional operation, namely the symmetric difference between two sets. The language also supports query functions to
I recently discussed introductory programming with a colleague who teaches Python at a university. He told me about the following introductory programming assignment: Let N be an integer parameter in the range [1, 9]. For each value of N, find all pairs of one-digit positive integers d1 and d2 that
In a previous article about Markov transition matrices, I mentioned that you can estimate a Markov transition matrix by using historical data that are collected over a certain length of time. A SAS programmer asked how you can estimate a transition matrix in SAS. The answer is that you can
Most homeowners know that large home improvement projects can take longer than you expect. Whether it's remodeling a kitchen, adding a deck, or landscaping a yard, big projects are expensive and subject to a lot of uncertainty. Factors such as weather, the availability of labor, and the supply of materials,
A previous article describes the metalog distribution (Keelin, 2016). The metalog distribution is a flexible family of distributions that can model a wide range of shapes for data distributions. The metalog system can model bounded, semibounded, and unbounded continuous distributions. This article shows how to use the metalog distribution in
Undergraduate textbooks on probability and statistics typically prove theorems that show how the variance of a sum of random variables is related to the variance of the original variables and the covariance between them. For example, the Wikipedia article on Variance contains an equation for the sum of two random
A SAS programmer wanted to compute the distribution of X-Y, where X and Y are two beta-distributed random variables. Pham-Gia and Turkkan (1993) derive a formula for the PDF of this distribution. Unfortunately, the PDF involves evaluating a two-dimensional generalized hypergeometric function, which is not available in all programming languages.
I previously discussed how to use the PUTLOG statement to write a message from the DATA step to the log in SAS. The PUTLOG statement is commonly used to write notes, warnings, and errors to the log. This article shows how to use the PRINTTOLOG subroutine in SAS IML software
A probabilistic card trick is a trick that succeeds with high probability and does not require any skill from the person performing the trick. I have seen a certain trick mentioned several times on social media. I call it "ladders" or the "ladders game" because it reminds me of the
Recently, I needed to know "how much" of a piecewise linear curve is below the X axis. The coordinates of the curve were given as a set of ordered pairs (x1,y1), (x2,y2), ..., (xn, yn). The question is vague, so the first step is to define the question better. Should
I recently gave a presentation about the SAS/IML matrix language in which I emphasized that a matrix language enables you to write complex analyses by using only a few lines of code. In the presentation, I used least squares regression as an example. One participant asked how many additional lines
A previous article discusses the definitions of three kinds of moments for a continuous probability distribution: raw moments, central moments, and standardized moments. These are defined in terms of integrals over the support of the distribution. Moments are connected to the familiar shape features of a distribution: the mean, variance,
The noncentral t distribution is a probability distribution that is used in power analysis and hypothesis testing. The distribution generalizes the Student t distribution by adding a noncentrality parameter, δ. When δ=0, the noncentral t distribution is the usual (central) t distribution, which is a symmetric distribution. When δ >
An integer can be represented in many ways. This article shows how to represent a positive integer in any base b. The most common base is b=10, but other popular bases are b=2 (binary numbers), b=8 (octal), and b=16 (hexadecimal). Each base represents integers in different ways. Think of a
The SELECT-WHEN statement in the SAS DATA step is an alternative to using a long sequence of IF-THEN/ELSE statements. Although logically equivalent to IF-THEN/ELSE statements, the SELECT-WHEN statement can be easier to read. This article discusses the two distinct ways to specify the SELECT-WHEN statement. You can use the first
It isn't easy to draw the graph of a function when you don't know what the graph looks like. To draw the graph by using a computer, you need to know the domain of the function for the graph: the minimum value (xMin) and the maximum value (xMax) for plotting
A colleague was struggling to compute a right-tail probability for a distribution. Recall that the cumulative distribution function (CDF) is defined as a left-tail probability. For a continuous random variable, X, with density function f, the CDF at the value x is F(x) = Pr(X ≤ x) = ∫
I previously wrote about partial leverage plots for regression diagnostics and why they are useful. You can generate a partial leverage plot in SAS by using the PLOTS=PARTIALPLOT option in PROC REG. One useful property of partial leverage plots is the ability to graphically represent the null hypothesis that a
A previous article shows how to compute the probability density function (PDF) for the multivariate normal distribution. In a similar way, you can compute the density function for the multivariate t distribution. This article discusses the density function for the multivariate t distribution, shows how to compute it, and visualizes
Recently, I needed to solve an optimization problem in which the objective function included a term that involved the quantile function (inverse CDF) of the t distribution, which is shown to the right for DF=5 degrees of freedom. I casually remarked to my colleague that the optimizer would have to
A common question on SAS discussion forums is how to randomly assign observations to groups. An application of this problem is assigning patients to cohorts in a clinical trial. For example, you might have 137 patients that you want to randomly assign to three groups: a control group, a group
In categorical data analysis, it is common to analyze tables of counts. For example, a researcher might gather data for 18 boys and 12 girls who apply for a summer enrichment program. The researcher might be interested in whether the proportion of boys that are admitted is different from the
Recently, I wrote about Bartlett's test for sphericity. The purpose of this hypothesis test is to determine whether the variables in the data are uncorrelated. It works by testing whether the sample correlation matrix is close to the identity matrix. Often statistics textbooks or articles include a statement such as
Recently, I showed how to use a heat map to visualize measurements over time for a set of patients in a longitudinal study. The visualization is sometimes called a lasagna plot because it presents an alternative to the usual spaghetti plot. A reader asked whether a similar visualization can be