Labeling objects in graphs can be difficult. SAS has a long history of providing support for labeling markers in scatter plots and for labeling regions on a map. This article discusses how the SGPLOT procedure decides where to put a label for a polygon. It discusses the advantages and disadvantages of the built-in labeling method. When the built-in method is not sufficient, you can specify the label positions yourself and use the TEXT statement in PROC SGPLOT to add labels wherever you want them, such as at the centroid of a polygon.
How polygons are labeled in PROC SGPLOT
The POLYGON statement in PROC SGPLOT supports the LABEL= option, which enables you to specify a label for each polygon. The documentation does not specify how the position of the label is determined, but the LABELLOC= option supports the values InsideBBox and OutsideBBox, from which we can infer that a bounding box ("BBox") is used to position the labels. By default, the label for a polygon is placed at the center of the bounding box for the polygon. Optionally, you can use the LABELPOS= option to place the label at the left, right, top, or bottom of the bounding box. You can also use the LABELLOC= option to specify whether the label is inside or outside of the bounding box.
The following example shows the default position of a label for a polygon, which is the center of the bounding rectangle. The data defines three triangles: an acute triangle, a right triangle, and an obtuse triangle. The labels are 'A', 'R', and 'O', respectively.
/* explore how triangles are labeled in PROC SGPLOT */ data Triangles; length ID $1; input ID n @; do vertex = 1 to n; input x y @; output; end; /* ID x1 y1 x2 y2 x3 y3 */ datalines; R 3 0 0 1 0 0 1 O 3 5 0 6 0 3 1 A 3 0 2 6 2 2 3 ; ods graphics / width=640px height=400; title "Labels for Polygons"; title2 "Position Are Determined by a Bounding Box"; proc sgplot data=Triangles noautolegend aspect=0.5; polygon x=x y=y id=ID / group=ID fill fillattrs=(transparency=0.5) outline label=ID LabelLoc=InsideBBox LabelPos=center labelattrs=(size=18); xaxis grid; yaxis grid; run; |
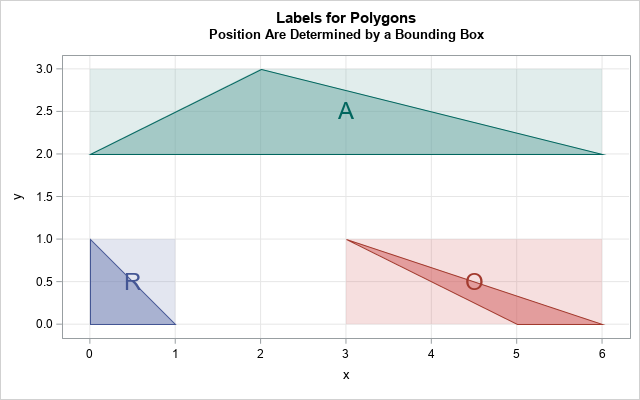
In the figure, I have overlaid a semi-transparent bounding rectangle for each triangle so that it is obvious that the label is placed at the center of the bounding rectangle, not in the center of the triangle. You can use the LABELPOS= option to place the label at other positions relative to the bounding rectangle.
Centroids of polygons
The graph shows that the center of a bounding rectangle is inside the acute triangle but is not inside the right and obtuse triangles. If you want to ensure that the label for a triangle is inside the triangle, you can use the centroid of the triangle. In fact, the centroid of any convex polygon is inside the polygon. (For a non-convex polygon, the centroid might not be inside the polygon. The classic example is an L-shaped figure.)
I have previously written about how to compute the centroid of a polygon in SAS, so let's compute the centroids for the three triangles and use that position for the label. This requires the following steps:
- Compute the centroids: I will reuse the SAS IML code from my previous article. To reuse the code, I need to convert the character labels into an equivalent set of numeric values. I can do this by computing the rank of the character values.
- Write the centroids to a SAS data set and concatenate the polygon data and the centroids.
- Call PROC SGPLOT. Use the POLYGON statement to plot the polygons and use the TEXT statement to overlay the labels at the centroid locations.
The following SAS IML program carries out the computation. I first copy/paste the previously written PolyCentroid function, which computes the centroids, and store it by using the STORE statement. The main program uses the LOAD statement to load the PolyCentroid function, which simplifies the main program.
/* "Compute the centroid of a polygon in SAS" (Wicklin, 2016) https://blogs.sas.com/content/iml/2016/01/13/compute-centroid-polygon-sas.html */ proc iml; /* _PolyCentroid: Return the centroid of a simple polygon. P is an N x 2 matrix of (x,y) values for consectutive vertices. N > 2. */ start _PolyCentroid(P); lagIdx = 2:nrow(P) || 1; /* vertices 2, 3, ..., N, 1 */ xi = P[ ,1]; yi = P[ ,2]; /* x_i and y_i for i=1..N */ xip1 = xi[lagIdx]; yip1 = yi[lagIdx]; /* x_{i+1} and y_{i+1}, x_{N+1}=x_1 */ d = xi#yip1 - xip1#yi; /* vector of difference of products */ A = 0.5 * sum(d); /* signed area of polygon */ cx = sum((xi + xip1) # d) / (6*A); /* X coord of centroid */ cy = sum((yi + yip1) # d) / (6*A); /* Y coord of centroid */ return( cx || cy ); finish; /* If the polygon P has two columns, return the centroid. If it has three columns, assume that the third column is an ID variable that identifies distinct polygons. Return the centroids of the multiple polygons. */ start PolyCentroid(P); if ncol(P)=2 then return( _PolyCentroid(P) ); ID = P[,3]; u = uniqueby(ID); /* starting index for each group */ result = j(nrow(u), 2); /* allocate vector to hold results */ u = u // (nrow(ID)+1); /* append (N+1) to end of indices */ do i = 1 to nrow(u)-1; /* for each group... */ idx = u[i]:(u[i+1]-1); /* get rows in group */ result[i,] = _PolyCentroid( P[idx, 1:2] ); end; return( result ); finish; store module=(_PolyCentroid PolyCentroid); QUIT; |
Now run the main program, which uses the PolyCentroid function. It also uses the rank of the labels to create a numerical vector that has a one-to-one correspondence with the labels:
proc iml; load module=(PolyCentroid); /* read polygon data */ use Triangles; read all var {x y} into P; read all var {ID}; close; /* If the ID variable is character, convert it to a numerical vector. See https://blogs.sas.com/content/iml/2023/05/22/rank-character-variables-sas.html */ start Ranktiec_Dense(C); D = design(C); /* an n x k matrix, where k = ncol(unique(C)) */ rank = D * T(1:ncol(D)); return rank; finish; nID = Ranktiec_Dense(ID); /* use nID as third column in polygon matrix */ P = P || nID; C = PolyCentroid(P); /* Get the label for each polygon. For triangles, these are the elements {1, 4, 7, ...} */ firstIdx = do(1, nrow(ID), 3); cID = ID[firstIdx]; *print C[r=cID]; /* write to SAS data set */ create Centroids from cID C[c={'cID' 'cx' 'cy'}]; append from cID C; close; QUIT; /* concatenate polygons and centroids */ data All; set Triangles Centroids; run; title "Label Polygons at Centroid"; proc sgplot data=All noautolegend; polygon x=x y=y id=ID / group=ID fill fillattrs=(transparency=0.5) outline; text x=cx y=cy text=cID / group=cID vcenter=BBox textAttrs=(Size=18); xaxis grid; yaxis grid; run; |
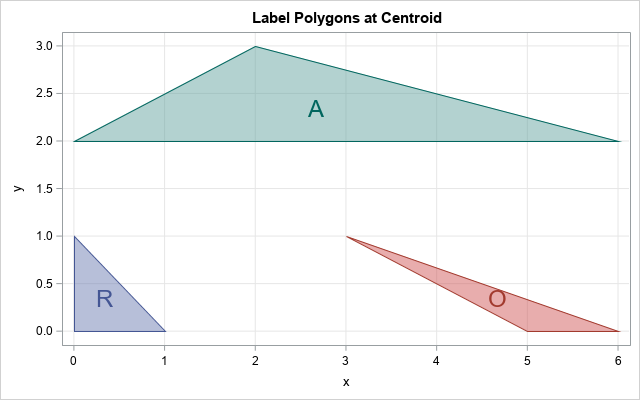
Success! The label for each triangle is now displayed at the centroid of the triangle.
Manually specifying the label positions
For small collections of polygons, you can, of course, manually specify the positions of the labels. You can create a data set that is similar to the Centroids data set and for which the labels are placed at any (cx,cy) coordinates that you specify.
Summary
This article explains that the POLYGON statement in PROC SGPLOT supports the LABEL= option for labeling a polygon. A label is placed according to a bounding box that surrounds the polygon. You can place the label at the center of the bounding box (the default), or you can use the LABELPOS= option to place the label at other positions relative to the bounding rectangle. If the LABELPOS= option does not provide you with enough flexibility, you can use the TEXT statement to manually label the polygons. This article shows how to compute the centroid for a polygon and to place a label at the centroid.
Appendix: The CENTROID autocall macro
Base SAS programmers might want to use the %CENTROID autocall macro to create positions for labels. As of SAS 9.4M6, the %CENTROID autocall macro distributed with Base SAS. The %CENTROID macro does a good job of finding positions for labels, but be aware that (in spite of the name) the locations are NOT the mathematical centroid positions.
The following SAS code calls the %CENTROID macro to create a different set of values at which you can label the triangles. The %CENTROID macro requires that the polygons be sorted according to the ID variable:
/* Show how to use the %CENTROID macro: https://go.documentation.sas.com/doc/en/pgmsascdc/9.4_3.5/graphref/annotate_pctcentroid.htm */ /* the macro requires that the polygons be sorted by ID */ proc sort data=Triangles out=TriIn; by ID vertex; run; %centroid(TriIn, CentOut, ID); /* write results to CentOut data set */ /* for easy comparison, sort the Centroids data */ proc sort data=Centroids out=CentroidsSorted; by cID; run; title 'Mathematical Centroids'; proc print data=CentroidsSorted noobs; run; title 'Positions from %Centroid Macro'; proc print data=CentOut noobs; run; |
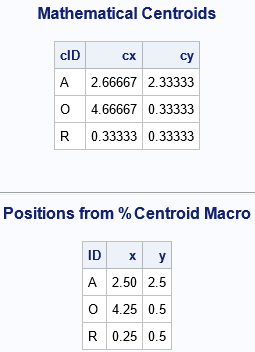
The output shows a set coordinates at which you can label the triangles. Each coordinate is in the "center" of its respective triangle, but not at the mathematical centroid.

2 Comments
Hi Rick,
thank you for your solution.
But, when I try to use your algorithm via GPS coordinates, the calculation does not work well with long decimals.
For example, coords data of a polygon:
CP1516190254.S 1 48.160426888 17.121807166
CP1516190254.S 2 48.160422807 17.121817646
CP1516190254.S 3 48.160403565 17.121869869
CP1516190254.S 4 48.160384151 17.12185281
CP1516190254.S 5 48.160407323 17.121790535
CP1516190254.S 6 48.160426888 17.121807166
it calculates centroid as 48.160163273 / 17.121744004 which is out of area.
I had to do changes like define new values:
X1000=(X*1000) - 17000;
Y1000=(Y*1000) - 48000;
P1000=X1000 || Y1000;
centroid = _PolyCentroid(P1000);
and in the calculation calculate it back:
cy1000=(cy+48000)/1000;
cx1000=(cx+17000)/1000;
return( cx1000 || cy1000 );
With this calculation is the centroid in 48.160405 / 17.12183
Thank you.
Yes, with badly scaled data, it is best to do the computation in a transformed coordinate system in which the coordinates have unit scale and then transform it back. If you want a more principled approach to replace your ad-hoc calculations, try using this rewritten module for the polygon centroid: