In a previous article about Markov transition matrices, I mentioned that you can estimate a Markov transition matrix by using historical data that are collected over a certain length of time. A SAS programmer asked how you can estimate a transition matrix in SAS. The answer is that you can use PROC FREQ to tabulate the number of transitions from one state to another. The procedure outputs counts and row percentages, either of which can be used to construct an estimate of the transition matrix.
Transition of families through economic classes
Let's start with some data. A charity provides education, healthcare, and agricultural assistance to an impoverished town in Central America. The charity wants to estimate the transition of families through various economic categories (or states) based on the total family income:
- State 1 is used for the poorest families who earn less than $2 per day per person.
- State 2 is for families who earn between $2-$10 per day per person.
- State 3 is for families who earn between $10-$20 per day per person.
- State 4 is for families who earn more than $20 per day per person.
The charity has access to the economic status of 160 families who have been in the program for five years. The following SAS DATA step defines the beginning and ending states for these families:
/* State 1: families who earn less than $2 per day State 2: families who earn between $2-$10 per day State 3: families who earn between $10-$20 per day State 4: families who earn more than $20 per day */ data History; retain ID; input BeginState EndState @@; ID + 1; datalines; 1 2 2 2 1 3 3 3 3 3 3 3 1 1 3 2 4 4 3 3 4 4 1 1 3 2 1 1 1 3 3 3 2 2 2 2 2 2 3 2 2 3 1 3 1 1 1 2 4 3 1 1 3 4 1 3 3 3 1 2 1 2 3 3 1 3 3 4 2 2 1 2 3 2 1 2 1 1 3 2 1 3 1 1 1 1 1 1 1 3 1 3 3 3 1 1 2 2 4 4 1 1 2 3 1 1 1 2 2 2 2 2 1 3 2 2 1 1 1 2 3 3 1 3 4 4 1 3 3 4 1 1 1 2 2 2 1 2 3 2 1 1 3 3 3 3 1 2 1 1 1 2 3 3 2 2 1 3 3 2 1 1 1 2 1 1 4 2 1 2 1 3 1 2 1 1 2 1 1 1 2 3 1 2 2 2 1 1 3 4 1 1 1 1 2 2 3 3 4 3 3 2 4 3 1 1 2 1 2 3 2 2 1 2 4 4 1 2 2 1 2 1 2 2 1 1 2 3 4 4 1 2 1 1 2 2 1 2 4 2 1 1 2 2 1 1 1 2 1 1 2 1 2 1 1 2 2 3 2 2 3 3 4 3 1 1 2 2 1 1 2 1 1 1 2 2 1 1 1 1 1 1 2 2 1 1 3 2 1 3 3 2 3 3 4 4 1 1 4 2 3 3 4 4 3 2 4 4 2 2 1 3 3 3 4 4 4 3 1 2 ; proc print data=History(obs=10) noobs; run; |
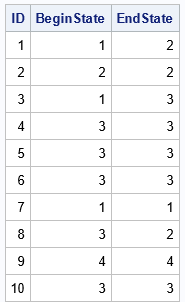
The output from PROC PRINT shows the beginning and ending states for 10 families. The first family was in State 1 at the beginning of the program but was in State 2 at the end of the program. The second family was in State 2 at the beginning and remained there. The third family was in State 1 at the beginning of the program but was in State 3 at the end, and so forth. You can use PROC FREQ to tabulate the matrix of counts for the transitions from one category into another, as follows:
proc freq data=History ; tables BeginState * EndState / out=freqOut sparse nocol nopercent outpct; run; |
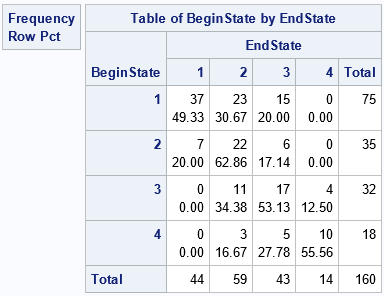
The output shows the counts and the row percentages for the data. The first row of the output is for the 75 families who started the program in State 1. Of those families, 37 (49%) remained in State 1 at the end of the program, 23 (31%) had progressed to State 2, and 15 (20%) had progressed to State 3. The second row of the output is for the 35 families who started the program in State 2. Of those families, 7 (20%) regressed to State 1, 22 (63%) remained in State 2, and 6 (17%) advanced to State 3. The other rows of the output are interpreted similarly.
You can use the row percentages to estimate the transition matrix. Merely divide each percentage by 100 to obtain a proportion. The proportion in the (i,j)th cell estimates the probability that a family that was in State i at the beginning of the program is in State j at the end of the program.
Reading the probabilities into a transition matrix
Most SAS programmers use SAS IML software to work with Markov transition matrices. The output from PROC FREQ is in "long form" in a data set that has 16 rows. You can read the estimates into a SAS IML vector and then reshape them into a 4 x 4 matrix. You can create the matrix in two ways: you can read the raw counts into a matrix and then divide each row by the row sum, or you can read the row percentages directly and then divide by 100 to obtain probabilities.
proc iml; use freqOut; read all var {'BeginState' 'EndState' 'Count' 'Pct_Row'}; /* read the states, counts, and row percentages */ close; N = sqrt(nrow(Count)); /* this should be an integer or else something is wrong */ names = EndState[1:N]; /* there should be N unique states */ /* estimate transition matrix by using counts of transitions */ C = shape(Count, N, N); /* matrix of raw counts for each transition */ M = C / C[,+]; /* divide each cell by total counts for the row */ print M[r=names c=names]; /* or read the PCT_ROW column directly */ M = shape(Pct_Row, N, N); /* raw counts */ M = M / 100; /* convert from percentages to proportions */ print M[r=names c=names]; |
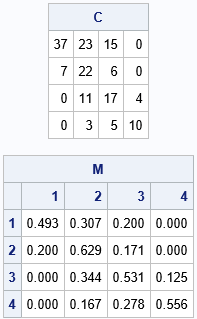
The matrix of counts shows that 23+15+6+4 = 48 out of 160 families improved their states during the program. Only 7+11+3+5 = 26 families ended the program in a worse state than they began.
The estimates for the transition probability matrix are the same for both calculations, so only one output is shown. For the poorest families (the first row), about 50% did not improve their economic state whereas the other 50% did. For the families that began in State 2, 20% slipped back into extreme poverty (unfortunately), 63% stayed in that state, and 17% increased their state. The remaining rows have similar interpretations.
Summary
This article shows how to use PROC FREQ in SAS to construct an estimate of a Markov transition matrix from historical data. For each subject in the study, you need to know the state of the subject at the beginning and at the end of a time period. You can then construct a matrix of counts for the transition of subjects between states. By dividing each row by its row sum, you obtain empirical probability estimates.

7 Comments
Rick-
I used to subscribe to blog but sometime in 2021 the emails stopped coming.
I tried resubscribing but there is something wrong with the webpage.
I keep trying to resubscribe periodically but get the same errors. Since it now appears the errors
aren't going to fix themselves, I thought you could help or point me in the right direction.
I am using chrome.
When I click in the space to enter my email address a box displays saying "This form is not secure. Autofill is turned off."
Next I enter my address anyway and a box pops up saying, "The information you’re about to submit is not secure
Because this form is being submitted using a connection that’s not secure, your information will be visible to others."
It gives me the option to click 'Go Back' or 'send anyway'. I click 'send anyway'.
Now another box pops up saying,
"Google
400. That’s an error.
The server cannot process the request because it is malformed. It should not be retried. That’s all we know."
Thanx.
Jim Loughlin
Hi Jim,
Yes, you are correct. The old Feedburner subscription method is no longer available. (Do an internet search for 'Feedburner is dead' and you will discover June 2021 is when email subscriptions stopped.) It has impacted blogs everywhere. SAS is searching for a more modern alternative to Feedburner. In the meantime, you might want to learn about how to subscribe to the blogs in Outlook via RSS or how to use a service like https://blogtrottr.com/ to build a list of blog feeds that come into your inbox.
I have relayed your concerns to the people at SAS who run the blog program.
Thanx Rick. I used to use RSS but like just getting an email better. I'll try your suggestion about https://blogtrottr.com/.
Rick,
I tried blogtrottr.com but get this error:
"Oops, we couldn't find any working feeds on 'https://blogs.sas.com/content/iml'!
This is generally due to a mis-typed URL, an inaccessible or invalid feed.
What now?
If you think this URL should work, you can check it with the W3C Feed Validation Service.
If it passes validation and you're still having trouble, please let us know."
Do you know what is the correct url for your blog.
Jim
I used the recommended feed validator and get
"It looks like this is a web page, not a feed. I looked for a feed associated with this page, but couldn't find one. Please enter the address of your feed to validate."
Do you know the address of the feed?
James and others, try adding "/feed" to the end:
https://blogs.sas.com/content/iml/feed
You can also get topical feeds this way, like:
https://blogs.sas.com/content/tag/statistical-programming/feed/
Chris-
Worked like a charm.
Thanx.