Detecting lags in nonlinear time series with PROC TSSELECTLAG in SAS Viya

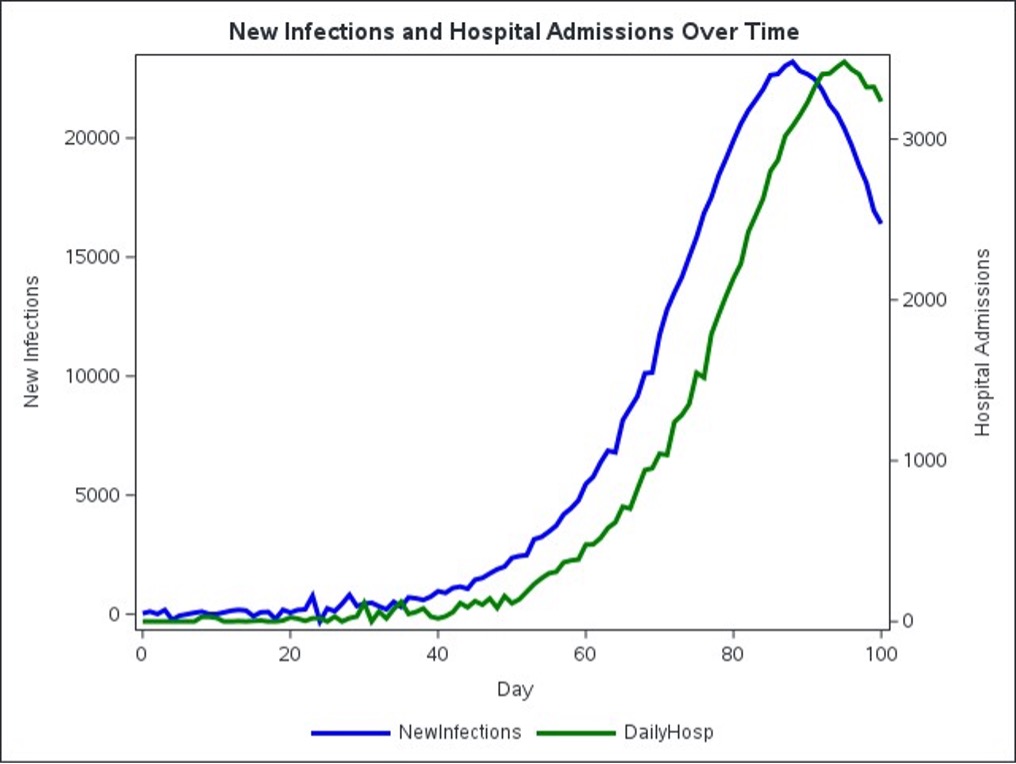
Accurately identifying lag structures between related time series is essential in public health forecasting, particularly during epidemics where delays between infections and hospitalizations affect planning. Using a simulated SEIR model and SAS Viya’s PROC TSSELECTLAG, distance correlation is shown to outperform Pearson correlation by correctly identifying nonlinear lag relationships—such as the true seven-day lag between new infections and hospital admissions.