Strengthen your programming skills with tips and techniques from the experts
Top 10 posts from The DO Loop in 2025

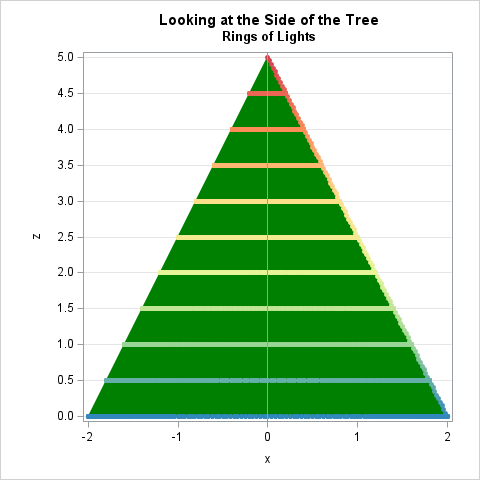
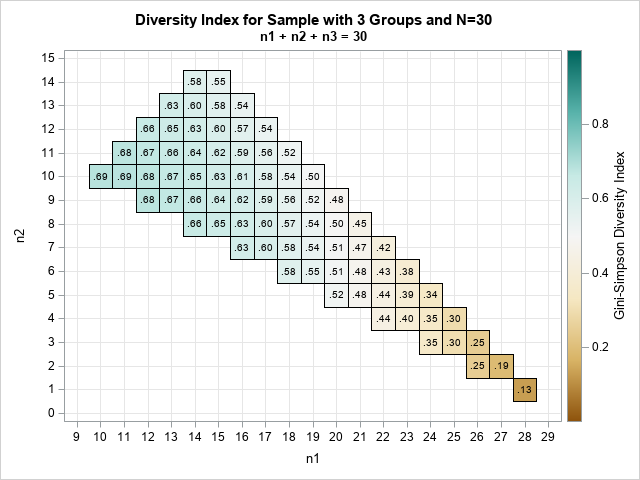
In 2025, I wrote about 60 articles for The DO Loop blog. My most popular articles were about SAS programming, data visualization, and statistics. This blog post lists some of the most popular articles from 2025. Read on for the Reader's Choice Awards in various categories! SAS Programming The following