Get the right information, with visual impact, to the people who need it
Automate the creation of a range attribute map in SAS

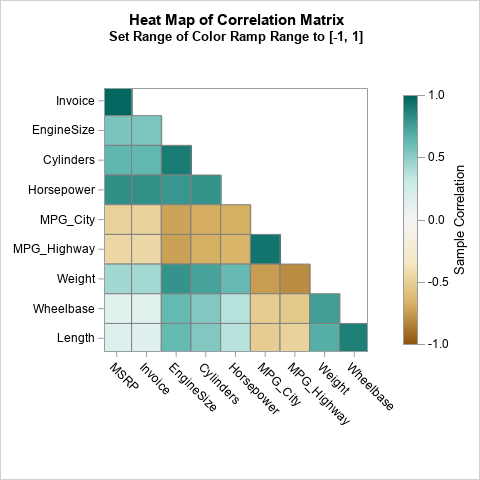
In SAS, range attribute maps enable you to specify the range of values that determine the colors used for graphical elements. There are various examples that use the GTL to define a range attribute map, but fewer examples that show how to use a range attribute map with PROC SGPLOT.