A previous article describes the DFBETAS statistics for detecting influential observations, where "influential" means that if you delete the observation and refit the model, the estimates for the regression coefficients change substantially. Of course, there are other statistics that you could use to measure influence. Two popular ones are the DFFTIS and Cook's distance, which is also known as Cook's D statistic. Both statistics measure the change in predicted values that occurs when you delete an observation and refit the model. This article describes the DFFITS and Cook's D statistics and shows how to compute and graph them in SAS.
DFFITS: How the predicted value changes if an observation is excluded
If you exclude an observation from a model and refit, the predicted values will change. The DFFITS statistic is a measure of how the predicted value at the i_th observation changes when the i_th observation is deleted. High-leverage points tend to pull the regression surface towards the response at that point, so the change in the predicted value at that point is a good indication of how influential the observation is. So that the DFFITS values are independent of the scale of the data, the change in predicted values is scaled by dividing by the standard error of the predicted value at that point. The exact formula is given in the documentation for PROC REG.. The book Regression Diagnostics by Belsley, Kuh, and Welsch (1980) suggests that an observation is influential if the magnitude of its DFFITS value exceeds 2*sqrt(p/n), where p is the number of effects in the model and n is the sample size.
PROC REG provides three ways to generate the DFFITS statistics for each observation:
- You can create a graph of the DFFITS statistics by using the PLOTS=DFFITS option.
- You can also display a table of the DFFITS (and other influence statistics) by using the INFLUENCE option in the MODEL statement.
- You can write the DFFITS statistics to a data set by using the DFFITS= option in the OUTPUT statement.
The following DATA step extracts a subset of n = 84 vehicles from the Sashelp.Cars data, creates a short ID variable for labeling observations, and sorts the data by the response variable, MPG_City. The data are sorted because the DFFITS statistic is graphed against the observation number, which is an arbitrary quantity. By sorting the data, you know that small observation numbers correspond to low values of the response and so forth. If you have a short ID variable, you can label the influential observations by using the LABEL suboption, as follows:
/* Create sample data */ data cars; set sashelp.cars; where Type in ('SUV', 'Truck'); /* make short ID label from Make and Model values */ length IDMakeMod $20; IDMakeMod = cats(substr(Make,1,4), ":", substr(Model,1,5)); run; /* Optional but helpful: Sort by response variable */ proc sort data=cars; by MPG_City; run; proc reg data=Cars plots(only) = DFFITS(label); model MPG_City = EngineSize HorsePower Weight; id IDMakeMod; run; quit; |
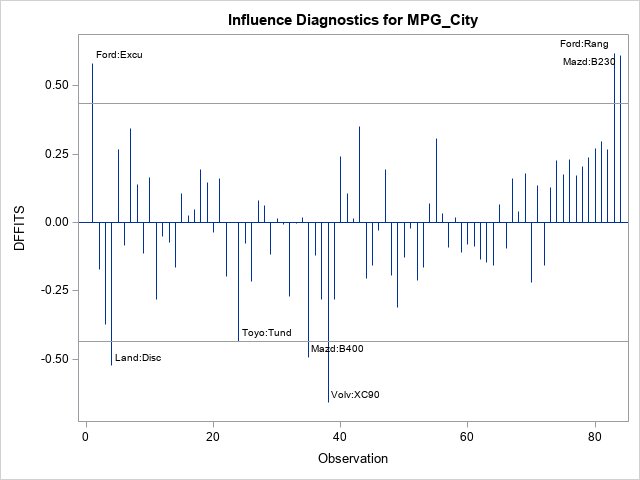
The DFFITS graph shows that three observations have a large positive DFFITS value. The observations are the Ford Excursion, the Ford Ranger, and the Madza BB230. For these observations, the predicted value (at the observation) is higher with the observation included in the model than if it were excluded. Thus, these observations "pull the regression up." There are four observations that have large negative DFFITS, which means that these observations "pull the regression down." They include the Land Rover Discovery and the Volvo XC90.
Cook's D: A distance measure for the change in regression estimates
When you estimate a vector of regression coefficients, there is uncertainty. The confidence regions for the parameter estimate is an ellipsoid in k-dimensional space, where k is the number of effects that you are estimating (including the intercept). Cook (1977) defines a distance that the estimates move within the confidence ellipse when the i_th point is deleted. Equivalently, Cook shows that the statistic is proportional to the squared studentized residual for the i_th observation. The documentation for PROC REG provides a formula in terms of the studentized residuals.
By default, PROC REG creates a plot of Cook's D statistic as part of the panel of diagnostic plots. (Cook's D is the second row and third column.) You can create a larger stand-alone plot by using the PLOTS=COOKSD option. Optionally, you can label the influential points (those whose Cook's D statistic exceeds 4/sqrt(n)) by using the LABEL suboption, as shown below:/* create multiple plots and label influential points */ proc reg data=Cars plots(only) = (CooksD(label) DFFits(label)); model MPG_City = EngineSize HorsePower Weight; id IDMakeMod; output out=RegOut pred=Pred rstudent=RStudent dffits=DFFits cookd=CooksD; /* optional: output statistics */ run; quit; |
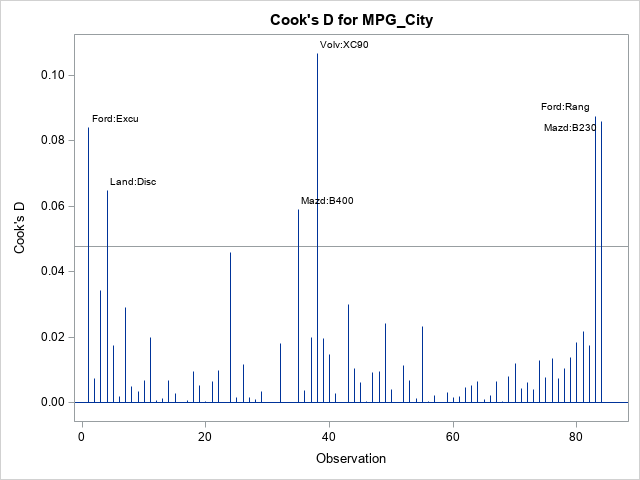
In many ways, the plot of Cook's D looks similar to a plot of the squared DFFITS statistics. Both measure a change in the predicted value at the i_th observation when the i_th observation is excluded from the analysis. The formula for Cook's D statistic squares a residual-like quantity, so it does not show the direction of the change, whereas the DFFITS statistics do show the direction. Otherwise, the observations that are "very influential" are often the same for both statistics, as seen in this example.

1 Comment
For a cautious use of Cook’s Distance, please see the section “Detecting highly influential observations” in “https://en.wikipedia.org/wiki/Cook%27s_distance”.