As the sharing economy grows, you can catch a ride on Uber, have meals delivered by Grubhub ... and even stay in someone else's house (rather than a hotel) via sites like Airbnb. And speaking of that last one, I recently read an article listing Airbnb's top 20 'wish-listed' homes in NC, and decided to create an interactive map to go along with it...
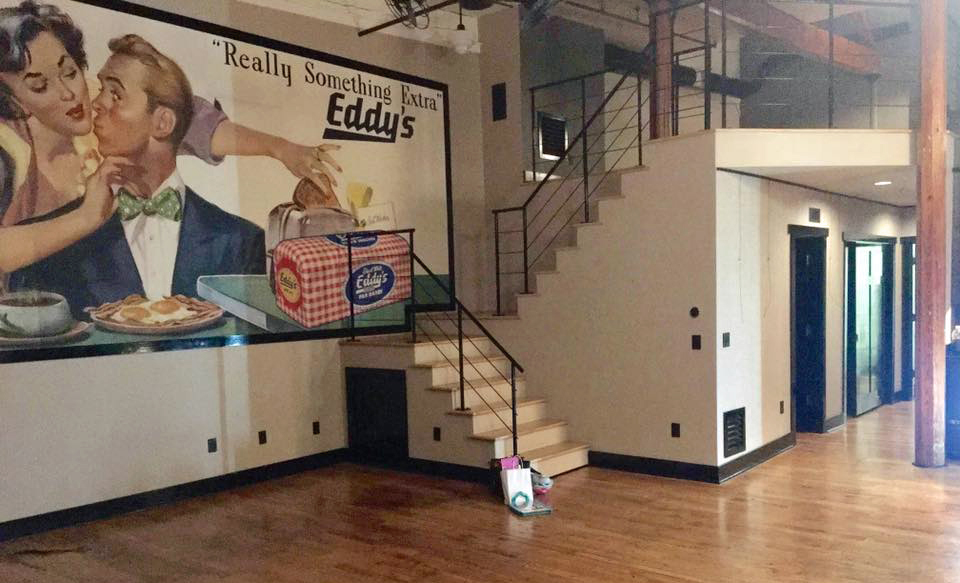
But first, here's a picture to get you into the mood for looking at cool/wish-listed homes. Here's a really neat place where my friend Claudia stayed, in downtown Raleigh (it used to be an old cotton mill, built in 1894).
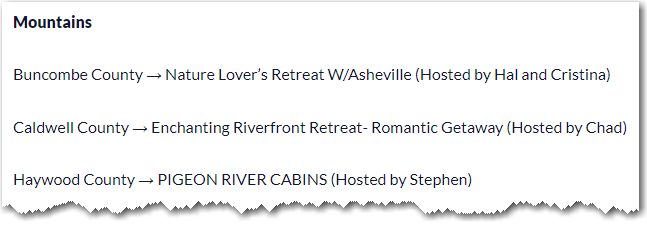
Now, let's dive into those wish-listed homes! I originally saw the list in a WRAL article, and found that it was just that - a text list. Here's a screen-capture of a portion. Their list was grouped into Coastal Plains, Mountains, and Piedmont. And it also listed the county. But other than that, there was no specific clue as to exactly where each of these houses was located. I tried looking up a few of the houses on the Airbnb website by searching for the title text, but that was very slow and cumbersome (and it was very difficult to find the matching house for some of them).
Being a map guy, of course I thought a map would be a better way to peruse this data! Therefore I painstakingly looked up each of the top 20 wish-listed homes, and created a dataset containing the title, the Airbnb URL, and the city. I then used Proc Geocode to estimate the lat/long coordinate of the city (so I could plot it on a map), using the following code:
proc geocode data=my_data out=my_data (rename=(x=long y=lat))
method=city lookupcity=sashelp.zipcode;
run;
Next, I grabbed the NC county map from the mapsgfk.us_counties map, and projected it (so it would look 'straight' and in pleasing proportions). I saved the projection parameters, and also applied them to the lat/long city coordinates. Here's the code:
proc gproject data=my_map out=my_map latlong eastlong degrees dupok
parmout=projparm;
id statecode county;
run;
proc gproject data=my_data out=my_data latlong eastlong degrees
parmin=projparm parmentry=my_map;
id;
run;
Then I created an annotate dataset, to draw a colored dot (outlined in gray) at each of the 20 locations. I added HTML tags to provide mouse-over text and drill-down, so you can click the dot markers to go to the Airbnb page with the details for each location.
data my_anno; set my_data;
length function $8 color $12 style $35 html $300;
xsys='2'; ysys='2'; hsys='3'; when='a';
function='pie'; size=1.9; rotate=360;
style='psolid'; color='cyan'; output;
html=
'title='||quote(trim(left(description))||'0d'x||trim(left(city)))||
' href='||quote(trim(left(airbnb_url)));
style='pempty'; color='gray33'; output;
run;
And finally, I plotted the map, and overlaid the annotated dot markers, using the following code:
proc gmap data=my_map map=my_map anno=my_anno;
id statecode county;
choro segment / levels=1 nolegend coutline=gray77';
run;
Here's a static image of the resulting map (click it to see the interactive version, with the mouse-over text and drilldowns).
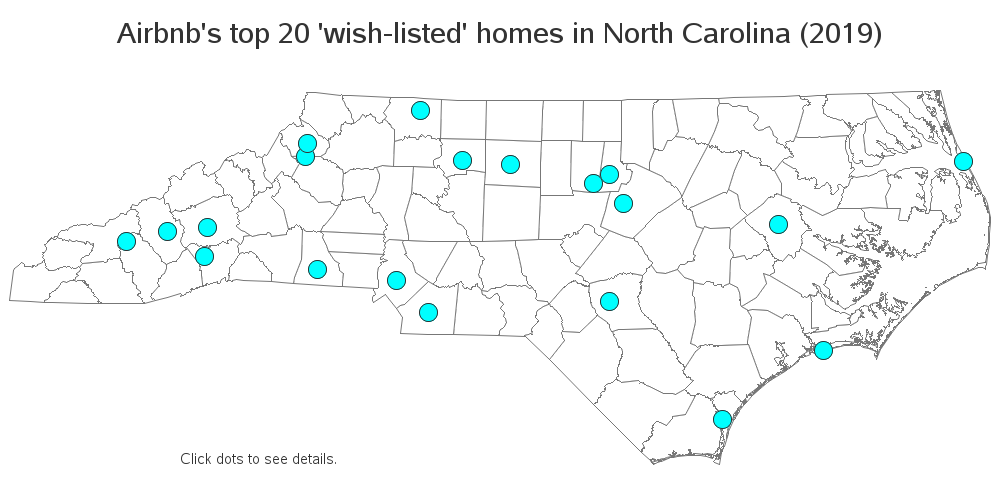
Doesn't this map help you quickly get a feel for these locations, much better than the text list?!? Hopefully you'll have fun exploring the map, and seeing the details of the 20 top 'wish-listed' Airbnb homes in NC! Maybe you'll even decide to visit one of them on your next vacation. 🙂
If you'd like to see the full SAS code (with data), click here.


1 Comment
What a great idea to present the data in a map! Thanks for giving us the code, too. I had fun clicking on the interactive map and viewing the Airbnbs.