For my third 'Rosetta Graph' example, I will focus on a simple pie chart. Hopefully this example will show you how to convert your SAS/Graph Proc Gchart pies into almost-identical Proc SGpie pies. And speaking of almost-identical pies, here are two beautiful pies my friend Beth made - which one do you think looks better? 🙂
Data Preparation
And now, on with the pie charts... I'll be using data from the sashelp data library again (so you don't have to worry about finding the data, and importing it). Sashelp.class contains data about 19 students in a small class. I'm going to create a pie chart with a blue slice representing the number of males, and a pink slice representing the number of females. There is a variable in the dataset called 'sex' with values of 'M' and 'F' that I could use, but I thought that was a little short/cryptic. Therefore I used a data step to create a new variable, with values of 'Males' and 'Females'.
data my_data; set sashelp.class;
length gender $10;
if sex='M' then gender='Males';
if sex='F' then gender='Females';
run;
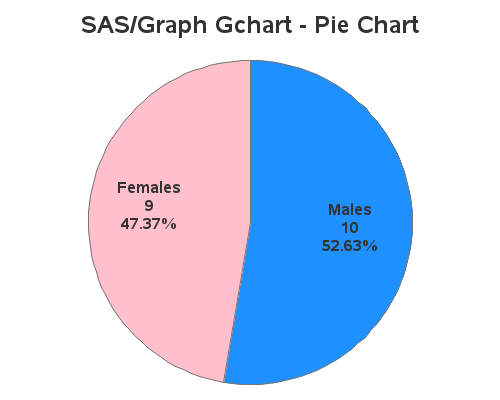
SAS/Graph Gchart - Pie Chart
You could create a pie chart using fewer options than I use here, but I want to show several of the options you might use (rather than just letting them default), so you can more easily see the differences in coding between the two procs. Let's start with the Gchart version:
goptions device=png xpixels=500 ypixels=400 ctitle=gray33 ctext=gray33 htext=12pt ftext='albany amt/bold';
pattern1 v=solid c=pink;
pattern2 v=solid c=dodgerblue;
title1 h=18pt ls=1.5 "SAS/Graph Gchart - Pie Chart";
proc gchart data=my_data;
pie gender / type=freq noheading
angle=90 clockwise descending
slice=inside value=inside percent=inside
coutline=gray77;
run;
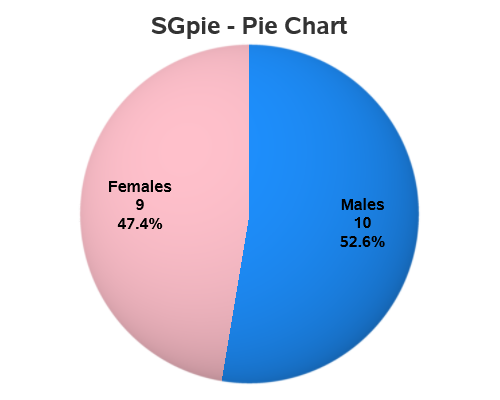
ODS Graphics SGpie - Pie Chart
ods graphics / imagefmt=png imagename="pie_sgpie" width=500px height=400px noborder noscale;
title1 c=gray33 h=18pt "SGpie - Pie Chart";
proc sgpie data=my_data;
styleattrs datacolors=(dodgerblue pink);
pie gender / startpos=edge
startangle=90 direction=clockwise sliceorder=respdesc
datalabeldisplay=all datalabelattrs=(size=12pt weight=bold);
run;
Code Explanation
Each bullet below describes some aspect of the chart, and describes how it was coded in both Gchart and SGpie. If you want to easily find these commands and options in the code above, I recommend using your browser's Ctrl+f functionality to find the text. Note that in the current SAS release (9.4 maintenance 6) SGpie is "pre-production" and there will likely be enhancements (and maybe changes) in future releases.
- In both procs (Gchart and SGpie) you start off with 'pie gender' - This specifies a pie chart (as opposed to a donut chart), and each gender is represented by a separate pie slice.
- To control the colors of the pie slices, I use pattern statements in Gchart, and styleattrs datacolors in SGpie. Note that you have to be careful with the order you specify the colors, to get the desired color associated with the desired Gender. (In a later example, I plan to show how to use "attribute maps" which let you map a specific color to a specific value!).
- In Gchart, I can specify type=freq when I want the slices to be sized based on a frequency count. In SGpie there isn't a specific option for a frequency count - it is simply implied if you don't specify a response variable.
- In SAS pie charts, angle=0 is at the 3 o'clock position, and 90 degrees is the 12 o'clock position. If we want the pie slices to start at the 12 o'clock position, we can specify angle=90 in Gchart, and startangle=90 in SGpie.
- In Gchart, pie slices start at the edge of the pie, whereas in SGpie the slices start in the middle (centered on the angle) by default. Therefore, to get both charts looking the same, I have to specify startpos=edge for the SGpie.
- If I want the pie slices to appear in order of the pie slice size, and proceed in the clockwise direction, I can specify clockwise descending in Gchart, and direction=clockwise sliceorder=respdesc in SGpie.
- When it comes to labeling the pie slices, you might want to show the gender, the frequency count, ... and maybe the percent for each slice. In Gchart you can do that using the following options: slice=inside value=inside percent=inside. In SGpie, use the following: datalabeldisplay=all.
- To control the size of the text labels, I use goptions ftext='albany amt/bold' in Gchart, and datalabelattrs=(size=12pt weight=bold) in SGpie.
All this talk of pie makes me kind of hungry - an hopefully it makes you hungry for more Rosetta Graph examples! 🙂


