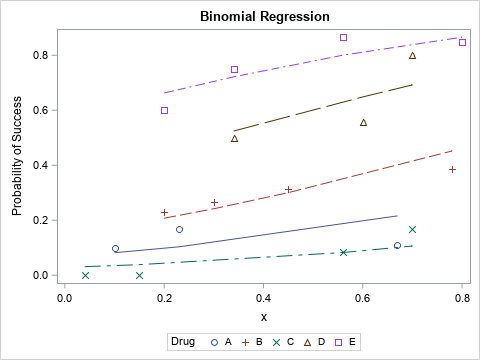
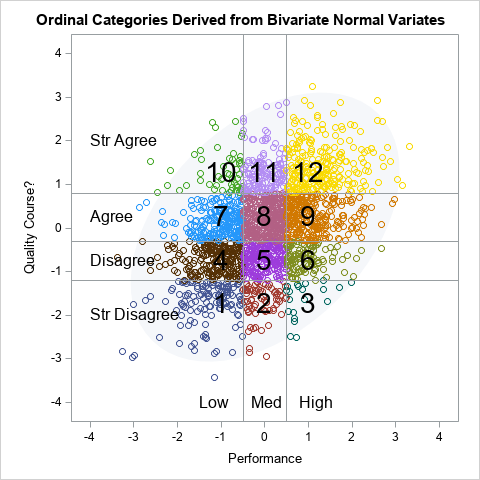
Knowing how to visualize a regression model is a valuable skill. A good visualization can help you to interpret a model and understand how its predictions depend on explanatory factors in the model. Visualization is especially important in understanding interactions between factors. Recently I read about work by Jacob A.
Tag: Regression
Here's a simulation tip: When you simulate a fixed-effect generalized linear regression model, don't add a random normal error to the linear predictor. Only the response variable should be random. This tip applies to models that apply a link function to a linear predictor, including logistic regression, Poisson regression, and
SAS regression procedures support several parameterizations of classification variables. When a categorical variable is used as an explanatory variable in a regression model, the procedure generates dummy variables that are used to construct a design matrix for the model. The process of forming columns in a design matrix is called
I've previously written about how to deal with nonconvergence when fitting generalized linear regression models. Most generalized linear and mixed models use an iterative optimization process, such as maximum likelihood estimation, to fit parameters. The optimization might not converge, either because the initial guess is poor or because the model
An analyst was using SAS to analyze some data from an experiment. He noticed that the response variable is always positive (such as volume, size, or weight), but his statistical model predicts some negative responses. He posted the data and asked if it is possible to modify the graph so
Maybe if we think and wish and hope and pray It might come true. Oh, wouldn't it be nice? The Beach Boys Months ago, I wrote about how to use the EFFECT statement in SAS to perform regression with restricted cubic splines. This is the modern way to use splines
When you use maximum likelihood estimation (MLE) to find the parameter estimates in a generalized linear regression model, the Hessian matrix at the optimal solution is very important. The Hessian matrix indicates the local shape of the log-likelihood surface near the optimal value. You can use the Hessian to estimate
I previously discussed how you can use validation data to choose between a set of competing regression models. In that article, I manually evaluated seven models for a continuous response on the training data and manually chose the model that gave the best predictions for the validation data. Fortunately, SAS
This article shows how to use SAS to simulate data that fits a linear regression model that has categorical regressors (also called explanatory or CLASS variables). Simulating data is a useful skill for both researchers and statistical programmers. You can use simulation for answering research questions, but you can also
Recently I was asked to explain the result of an ANOVA analysis that I posted to a statistical discussion forum. My program included some simulated data for an ANOVA model and a call to the GLM procedure to estimate the parameters. I was asked why the parameter estimates from PROC
If you want to bootstrap the parameters in a statistical regression model, you have two primary choices. The first, case resampling, is discussed in a previous article. This article describes the second choice, which is resampling residuals (also called model-based resampling). This article shows how to implement residual resampling in
If you want to bootstrap the parameters in a statistical regression model, you have two primary choices. The first is case resampling, which is also called resampling observations or resampling pairs. In case resampling, you create the bootstrap sample by randomly selecting observations (with replacement) from the original data. The
A SAS programmer recently asked me how to compute a kernel regression in SAS. He had read my blog posts "What is loess regression" and "Loess regression in SAS/IML" and was trying to implement a kernel regression in SAS/IML as part of a larger analysis. This article explains how to
A SAS programmer recently asked how to interpret the "standardized regression coefficients" as computed by the STB option on the MODEL statement in PROC REG and other SAS regression procedures. The SAS documentation for the STB option states, "a standardized regression coefficient is computed by dividing a parameter estimate by
My colleague, Robert Allison, recently published an interesting visualization of the relationship between chess ratings and age. His post was inspired by the article "Age vs Elo — Your battle against time," which was published on the chess.com website. ("Elo" is one of the rating systems in chess.) Robert Allison's
This article shows how to score (evaluate) a quantile regression model on new data. SAS supports several procedures for quantile regression, including the QUANTREG, QUANTSELECT, and HPQUANTSELECT procedures. The first two procedures do not support any of the modern methods for scoring regression models, so you must use the "missing
SAS enables you to evaluate a regression model at any location within the range of the data. However, sometimes you might be interested in how the predicted response is increasing or decreasing at specified locations. You can use finite differences to compute the slope (first derivative) of a regression model.
When you fit nonlinear fixed-effect or mixed models, it is difficult to guess the model parameters that fit the data. Yet, most nonlinear regression procedures (such as PROC NLIN and PROC NLMIXED in SAS) require that you provide a good guess! If your guess is not good, the fitting algorithm,
A previous article showed how to use a calibration plot to visualize the goodness-of-fit for a logistic regression model. It is common to overlay a scatter plot of the binary response on a predicted probability plot (below, left) and on a calibration plot (below, right): The SAS program that creates
A SAS programmer asked how to label multiple regression lines that are overlaid on a single scatter plot. Specifically, he asked to label the curves that are produced by using the REG statement with the GROUP= option in PROC SGPLOT. He wanted the labels to be the slope and intercept
I previously showed an easy way to visualize a regression model that has several continuous explanatory variables: use the SLICEFIT option in the EFFECTPLOT statement in SAS to create a sliced fit plot. The EFFECTPLOT statement is directly supported by the syntax of the GENMOD, LOGISTIC, and ORTHOREG procedures in
Slice, slice, baby! You've got to slice, slice, baby! When you fit a regression model that has multiple explanatory variables, it is a challenge to effectively visualize the predicted values. This article describes how to visualize the regression model by slicing the explanatory variables. In SAS, you can use the
If you use SAS regression procedures, you are probably familiar with the "stars and bars" notation, which enables you to construct interaction effects in regression models. Although you can construct many regression models by using that classical notation, a friend recently reminded me that the EFFECT statement in SAS provides
Restricted cubic splines are a powerful technique for modeling nonlinear relationships by using linear regression models. I have attended multiple SAS Global Forum presentations that show how to use restricted cubic splines in SAS regression procedures. However, the presenters have all used the %RCSPLINE macro (Frank Harrell, 1988) to generate
Most regression models try to model a response variable by using a smooth function of the explanatory variables. However, if the data are generated from some nonsmooth process, then it makes sense to use a regression function that is not smooth. A simple way to model a discontinuous process in
Today's post illustrates the REG, PBSPLINE, LOESS, SERIES, and SPLINE statements in PROC SGPLOT. The GROUP= and BREAK options in the SERIES statement are also discussed.
A previous post discusses how the loess regression algorithm is implemented in SAS. The LOESS procedure in SAS/STAT software provides the data analyst with options to control the loess algorithm and fit nonparametric smoothing curves through points in a scatter plot. Although PROC LOESS satisfies 99.99% of SAS users who
Loess regression is a nonparametric technique that uses local weighted regression to fit a smooth curve through points in a scatter plot. Loess curves are can reveal trends and cycles in data that might be difficult to model with a parametric curve. Loess regression is one of several algorithms in
What is weighted regression? How does it differ from ordinary (unweighted) regression? This article describes how to compute and score weighted regression models. Visualize a weighted regression Technically, an "unweighted" regression should be called an "equally weighted " regression since each ordinary least squares (OLS) regression weights each observation equally.
Last week I read an interesting paper by Bob Rodriguez: "Statistical Model Building for Large, Complex Data: Five New Directions in SAS/STAT Software." In it, Rodriguez summarizes five modern techniques for building predictive models and highlights recent SAS/STAT procedures that implement those techniques. The paper discusses the following high-performance (HP)