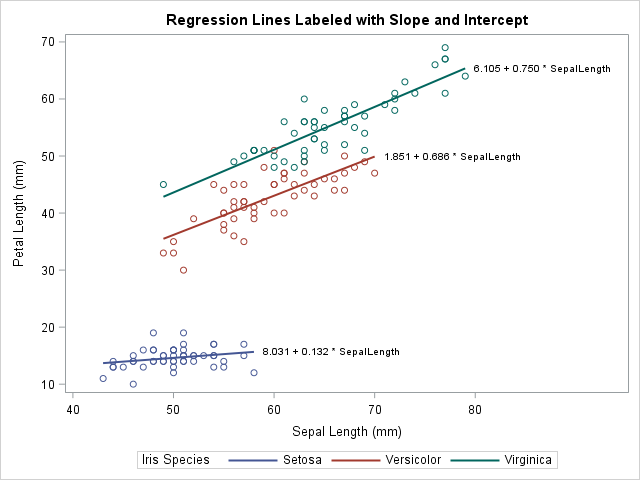
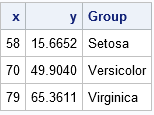
A SAS programmer asked how to label multiple regression lines that are overlaid on a single scatter plot. Specifically, he asked to label the curves that are produced by using the REG statement with the GROUP= option in PROC SGPLOT. He wanted the labels to be the slope and intercept of a linear regression line, as shown to the right. (Click to enlarge.)
Initially I thought that you could use the CURVELABEL option on the REG statement to generate labels, as follows:
proc sgplot data=sashelp.iris noautolegend; reg x=SepalLength y=PetalLength / group=Species CURVELABEL; /* does NOT work */ run; |
However, the SAS log displays the following warning:
WARNING: CURVELABEL not supported for fit plots when a group variable is
used. The option will be ignored. |
Fortunately, I thought of two other ways to create a graph that has a regression line for each group level, each with its own label. For linear regression, you can use the LINEPARM statement, as shown in the article "Add a diagonal line to a scatter plot." For general (possibly nonlinear) regression curves, you can find the location of the end of the curve and use the TEXT statement in PROC SGPLOT to add a label at that location.
Label the regression line for each group: The LINEPARM statement
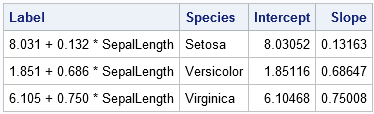
Let's use Fisher's Iris data set for our example data. The Iris data contains 50 observations for each of three species of flowers: iris Setosa, iris Versicolor, and iris Virginica. The programmer wants to label the regression line for each species by using the slope and intercept of the line. The first step is to create a SAS data set that contains the intercept and slope for each curve. You can use the OUTEST= option in PROC REG to write the parameter estimates (intercept and slope) to a SAS data set. You can then use the CATX function in the DATA step to construct the labels, as follows:
proc sort data=sashelp.iris out=iris; by Species; run; /* compute parameter estimates */ proc reg data=iris outest=PE noprint; by Species; model PetalLength = SepalLength; run; /* construct labels from the parameter estimates */ data Labels; length Label $30; set PE(rename=(SepalLength=Slope)); /* independent variable */ Label = catx(" ", put(Intercept, BestD5.), '+', /* separate by blank */ put(Slope, BestD5.), '* SepalLength'); keep Label Species Intercept Slope; run; proc print noobs; run; |
The LABELS data set contains a label for the regression line in each group. You can use other labels if you prefer. The following DATA step combines the labels with the original data. The SCATTER statement in PROC SGPLOT displays the data. The LINEPARM statement draws the lines and adds labels to the end of each line.
data Plot; set iris Labels; run; title "Regression Lines Labeled with Slope and Intercept"; proc sgplot data=Plot; scatter x=SepalLength y=PetalLength / group=Species; lineparm x=0 y=Intercept slope=Slope / group=Label curvelabel curvelabelloc=outside clip; run; |
Success! The regression line for each group is labeled by the formula for the line. For more information about displaying the formula for a regression line, see the SAS/STAT example "Adding Equations and Special Characters to Fit Plots."
Label the regression line for each group: The TEXT statement
The preceding method uses the LINEPARM statement, so it only works for lines. However, the user actually wanted to use the REG statement. With a little work, you can label curves that are produced by the REG statement or other curve-fitting statements. The idea is to obtain the data coordinates for the end of the curve, which will become the location of the label.
You might be thinking, if the curve is produced by a regression statement in PROC SGPLOT, how can we get the data coordinates out of the plot and into a data set? The answer is simple: You can use the ODS OUTPUT statement to write a data set that contains the data in any ODS graph. You can apply this trick to any ODS graph, including graphs created by SGPLOT, as Warren Kuhfeld has recently discussed. The following call to PROC SGPLOT uses an ODS OUTPUT statement to create a SAS data set that contains the data in the regression plot:
/* use ODS OUTPUT to find data coordinates of end of lines */ proc sgplot data=iris; ods output sgplot=RegPlot; /* name of ODS table is 'sgplot' */ reg x=SepalLength y=PetalLength / group=Species; run; proc contents short varnum; run; /* find names used by graph */ |
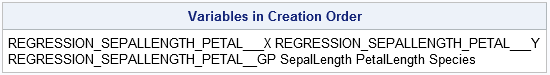
The variable names that are automatically manufactured by SAS procedures can be long and unwieldy, as shown by the call to PROC CONTENTS. I usually rename the long names to simpler names such as X, Y, GROUP, and so on. You should look at the structure of the REGPLOT data set so that the next DATA step makes sense. The DATA step saves only the last coordinates along the curve for each group (species).
data Coords; set RegPlot( rename=(REGRESSION_SEPALLENGTH_PETAL___X = x REGRESSION_SEPALLENGTH_PETAL___Y = y REGRESSION_SEPALLENGTH_PETAL__GP = Group) where=(x ^=.)); by Group; if last.Group; keep x y Group; run; proc print noobs; run; |
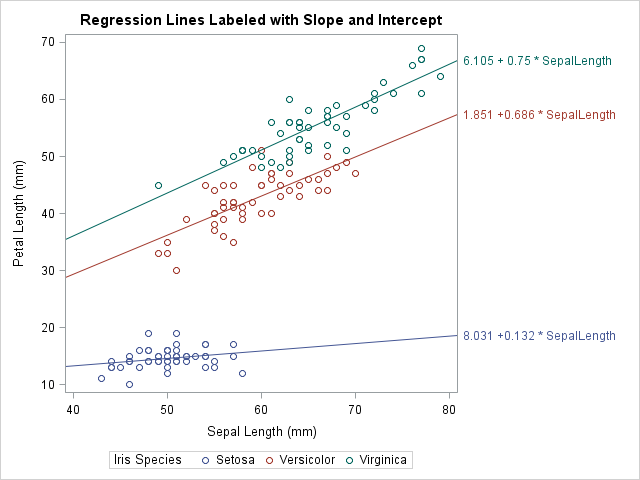
The COORDS data contains the location (in data coordinates) of the end of each regression line. You can overlay labels at these coordinates to label the curves. From the preceding section, the labels are in the LABELS data set, so you can merge the two data sets, as follows:
/* combine the positions and labels with original data */ data A; merge Labels Coords(rename=(Group=Species)); by Species; run; data Plot; set iris A; /* optional: pad label with blanks on the left (if length is long enough) */ Label = " " || Label; run; proc sgplot data=Plot; reg x=SepalLength y=PetalLength / group=Species; text x=x y=y text=Label / position=right; run; |
The graph is shown at the top of this article.
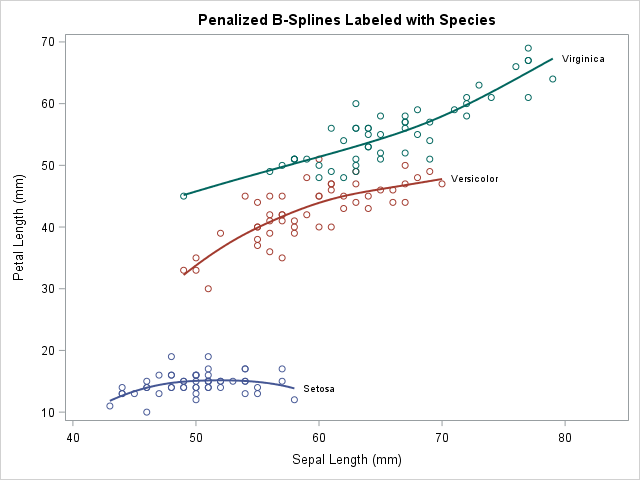
Label multiple regression curves
If you study the previous section, you will see that the code does not rely on the linearity of the regression model. The same code works for polynomial regression and nonparametric regression curves such as are created by the LOESS and PBSPLINE statements in PROC SGPLOT. The following graph shows a PBSPLINE fit to the IRIS data. Because the penalized B-spline curve is nonparametric, there is no equation to display as a label. Instead, I use the Species name as a label and suppress the legend at the bottom of the graph. You can download the SAS program that creates this and all the graphs in this article.

6 Comments
Wonderful work. God bless you
Thanks for providing a solution to the problem.
However, the question is: Why does everything with SAS have to be so terribly hard! This is not a cheap software package! So why does SAS not modify the SGPLOT and SGPANEL procedures to be USERFRIENDLY instead of requiring MANUAL WORKAROUNDS for something as simple as group specific curve labels?
I understand your frustration. I, too, was frustrated, which is why I took the time to figure out a workaround and publish this article to help others who might be in the same situation. I do not know why this option was not implemented. The goal of the SGPLOT procedure is to provide a simple syntax that enables 95% of the users to perform 95% of their tasks. For the less common tasks, there are workarounds or the Graph Template Language (GTL).
If you think this feature should be considered for future development, make a suggestion in the SAS-ware Ballot.
Hi, Rick,
Thank you for the nice article. I have the following comments:
(1). I am wondering if we can create annotation dataset and use SGANNO= option in PROC SGPLOT to annotate the regression lines. Please advise and provide and an example. I am not sure if SGANNO= option is available at the time this blog was published.
(2). I had tried out the example using the second method described in the blog, I note that using the second method, the regression equations are black in color. Is there any way to have the same color as the data displayed in the plot.
(3). I have macro-ized this method to create multiple such plots with different variables for the dependent variable (y) and the explanatory variable (x). It seems it is hard to predict what will be generated in the REGPLOT dataset. Since SAS datasets are confined to 32 characters, the system has made adjustment to the variable names. I ended up creating the datasets from PROC CONTENTS and looking for variable names with '__X', '__Y' and '__GP' to identify these variables.
(4). Some adjustment on the coordinates for the regression equations may be needed if the end of the regression lines are close to each other. Otherwise, the equations may be overlapped.
(5). I have used 'if first.groups' in Coords dataset and get the coordinates that are the beginning of the regression lines. And use position=left in the text statement. However, it does not look as nice.
(6). Has new features been implemented to make this annotation easier? This may be related to (1).
Thank you very much for the blog! I enjoy your posting and blog and I learn a lot from them. Please keep up the good work.
I am looking forward to your reply.
Thanks for sharing your experience.
1) Yes, you could create an SG annotation data set. That is not how I prefer to work with SG graphs. If you want an example, as your question on SAS Support Communities.
2) Yes, add GROUP=Species.
3) OK. Sounds reasonable.
4) True. Also, reducing the font size might help.
5) OK. The POSITION= option also supports using a text variable with values like "top", "bottomright", and so on, but I think that might be hard to automate in a macro.
6) If you are using SAS 9.4, I am not familiar with recent changes to PROC SGPLOT that would help.
My closing statement is that you might be trying to use a graph to display information that is better displayed by using a table. Consider whether the ParameterEstimates table from PROC GLM might be more suitable to convey the information.
Hi, Rick,
Thank you for your reply. I have the following comments.
1). I research on that. Thankyou.
2). I have used GROUP= following the example. But it still appears in black, not the color related to the group variable. i tried to assign values to TEXTCOLOR. But it still does not work.
3). Strange as it may sound, a lot of times, I actually find that 32-character in dataset name is insufficient. I am doing some exploratory analysis with different combination, so I actually run out of
characters to be used in a SAS dataset! Will SAS consider allowing us to have more characters in s dataset name?
4). Reducing the font size may not always help if the end of the regression lines are at almost same point. We end up adjusting the y coordinate values by a percent of its original values. We increase the higher value of Y by a certain percent, and decrease the lower value of Y by a certain percent.
Thank you so much for your response! I have learnt so much from you!
Alice