I've previously written about how to deal with nonconvergence when fitting generalized linear regression models. Most generalized linear and mixed models use an iterative optimization process, such as maximum likelihood estimation, to fit parameters. The optimization might not converge, either because the initial guess is poor or because the model is not a good fit to the data. SAS regression procedures for which this might happen include PROC LOGISTIC, GENMOD, MIXED, GLMMIX, and NLMIXED.
For mixed models, several problems can occur if you have a misspecified model. One issue
results in the following note in the SAS log:
NOTE: Estimated G matrix is not positive definite.
This article describes what the note means, why it might occur, and what to do about it. If you encounter this note during a BY-group analysis or simulation study, this article shows how to identify the samples that have the problem.
There are two excellent references that discuss issues related to convergence in the SAS mixed model procedures:
- Kiernan, Tao, and Gibbs (2012), "Tips and Strategies for Mixed Modeling with SAS/STAT Procedures"
- Kiernan (2018), "Insights into Using the GLIMMIX Procedure to Model Categorical Outcomes with Random Effects"
What is the G matrix?
Before we discuss convergence, let's review what the G matrix is and why it needs to be positive definite.
The matrix formulation of a mixed model is
Y = X β + Z γ + ε
where β is a vector of fixed-effect parameters. The random effects are assumed to be random realizations from multivariate normal distributions. In particular, γ ~ MVN(0, G) and ε ~ MVN(0, R), where G and R are covariance matrices. The variance-covariance matrix G is often used to specify subject-specific effects, whereas R specifies residual effects. A goal of mixed models is to specify the structure of the G and/or R matrices and estimate the variance-covariance parameters.
Because G is a covariance matrix, G must be positive semidefinite. A nondegenerate covariance matrix will be fully positive definite. However, estimates of G might not have this property. SAS alerts you if the estimate is not positive definite.
As stated in Kiernan (2018, p. ), "It is important that you do not ignore this message."
Reasons the estimated G matrix is not positive definite
A SAS Usage Note states that the PROC MIXED message means that "one or more variance components on the RANDOM statement is/are estimated to be zero and could/should be removed from the model." Kiernan, Tao, and Gibbs (2012) and Kiernan (2018) describe several reasons why an estimated G matrix can fail to be positive definite. Two of the more common reasons include:
- There is not enough variation in the response. After controlling for the fixed effects, there isn't any (or much) variation for the random effects. You might want to remove the random effect from the model. (KTG, p. 9)
- The model is misspecified. You might need to modify the model or change the covariance structure to use fewer parameters. (Kiernan, p. 18)
Convergence issues in simulation studies or BY-group analyses
If you encounter the note "Estimated G matrix is not positive definite" for real data, you should modify the model or collect more data. In a simulation study, however, there might be simulated samples that do not fit the model even when the data is generated from the model! This can happen for very small data sets and for studies in which the variance components are very small. In either case, you might want to identify the samples for which the model fails to converge, either to exclude them from the analysis or to analyze them by using a different model. The same situation can occur for few BY groups during a traditional BY-group analysis.
The following SAS program illustrates how to detect the samples for which the estimated G matrix is not positive definite. The 'SP' data are from an example in the PROC MIXED documentation. The data set named 'ByData' is constructed for this blog post. It contains four copies of the real data, along with an ID variable with values 1, 2, 3, and 4. For the first copy, the response variable is set to 0, which means that there is no variance in the response. For the third copy, the response variable is simulated from a normal distribution. It has variance, but does not conform to the model. The call to PROC MIXED fits the same random-effects model to all four samples:
/* Example from PROC MIXED documentation: https://bit.ly/2YEmpGw */ data sp; input Block A B Y @@; datalines; 1 1 1 56 1 1 2 41 1 2 1 50 1 2 2 36 1 3 1 39 1 3 2 35 2 1 1 30 2 1 2 25 2 2 1 36 2 2 2 28 2 3 1 33 2 3 2 30 3 1 1 32 3 1 2 24 3 2 1 31 3 2 2 27 3 3 1 15 3 3 2 19 4 1 1 30 4 1 2 25 4 2 1 35 4 2 2 30 4 3 1 17 4 3 2 18 ; /* concatenate four copies of the data, but modify Y for two copies */ data ByData; call streaminit(1); set sp(in=a1) sp(in=a2) sp(in=a3) sp(in=a4); SampleID = a1 + 2*a2 + 3*a3 + 4*a4; if a1 then Y = 0; /* response is constant (no variation) */ if a3 then Y = rand("Normal", 31, 10); /* response is indep of factors */ run; /* suppress ODS output: https://blogs.sas.com/content/iml/2013/05/24/turn-off-ods-for-simulations.html */ %macro ODSOff(); ods graphics off; ods exclude all; ods noresults; %mend; %macro ODSOn(); ods graphics on; ods exclude none; ods results; %mend; %ODSOff proc mixed data=ByData; by sampleID; class A B Block; model Y = A B A*B; random Block A*Block; ods output ConvergenceStatus=ConvergeStatus; run; %ODSOn |
The SAS log displays various notes about convergence. The second and fourth samples (the doc example) converged without difficulty. The log shows a WARNING for the first group. The third group displays the note Estimated G matrix is not positive definite.
NOTE: An infinite likelihood is assumed in iteration 0 because of a nonpositive residual variance estimate.
WARNING: Stopped because of infinite likelihood.
NOTE: The above message was for the following BY group:
      SampleID=1

NOTE: Convergence criteria met.
NOTE: The above message was for the following BY group:
      SampleID=2
NOTE: Convergence criteria met.

NOTE: Estimated G matrix is not positive definite.
NOTE: The above message was for the following BY group:
      SampleID=3

NOTE: Convergence criteria met.
NOTE: The above message was for the following BY group:
SampleID=4 |
Notice that the ODS OUTPUT statement writes the ConvergenceStatus table for each BY group to a SAS data set called ConvergeStatus. For each BY group, the ConvergenceStatus table is appended to a SAS data set called ConvergeStatus. The result of the PROC PRINT statement shows the columns of the table for each of the four groups:
proc print data=ConvergeStatus; run; |
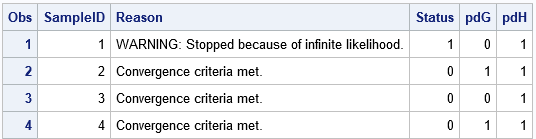
The SampleID column is the value of the BY-group variable. The Reason column explains why the optimization process terminated. The Status column is 0 if the model converged and nonzero otherwise. Note that the third model converged, even though the G matrix was not positive definite!
To detect nonpositive definite matrices, you need to look at the pdG column, The pdG indicates which models had a positive definite G matrix (pdG=1) or did not (pdG=0). Although I do not discuss it in this article, the pdH column is an indicator variable that has value 0 if the SAS log displays the message NOTE: Convergence criteria met but final hessian is not positive definite.
The pdG column tells you which models did not have a positive definite variance matrix. You can merge the ConverenceStatus table with the original data and exclude (or keep) the samples that did not converge or that had invalid variance estimates, as shown in the following DATA step:
/* keep samples that converge and for which gradient and Hessian are positive definite */ data GoodSamples; merge ByData ConvergeStatus; by SampleID; if Status=0 & pdG & pdH; run; |
If you run PROC MIXED on the samples in the GoodSamples data set, all samples will converge without any scary-looking notes.
In summary, this article discusses the note Estimated G matrix is not positive definite, which sometimes occurs when using PROC MIXED or PROC GLMMIX in SAS. You should not ignore this note. This note can indicate that the model is misspecified. This article shows how you can detect this problem programmatically during a simulation study or a BY-group analysis. You can use the ConvergenceStatus table to identify the BY groups for which this the problem occurs. Kiernan, Tao, and Gibbs (2012) and Kiernan (2018) provide more insight into this note and other problems that you might encounter when fitting mixed models.
