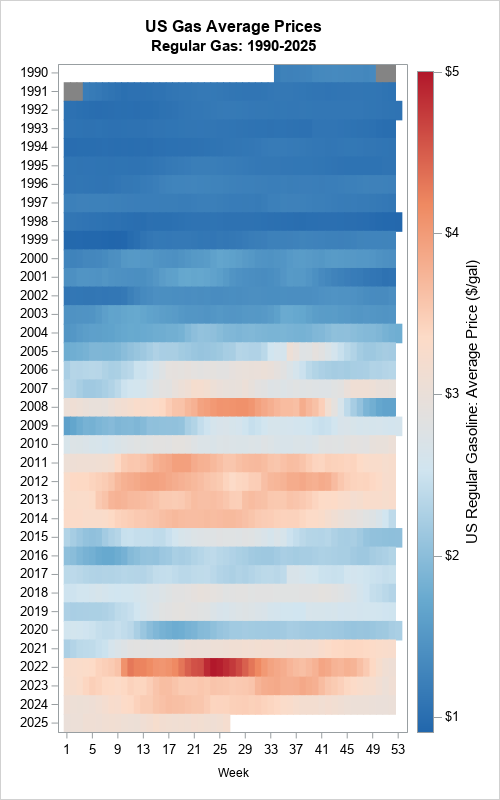
Tag: time series

Advanced Analytics | Data Visualization
Kevin Scott 0
The Empirical Mode Decomposition for handling non-stationary time series

Empirical Mode Decomposition (EMD) is a powerful time-frequency analysis technique that allows for the decomposition of a non-stationary and non-linear signal into a series of intrinsic mode functions (IMFs). The method was first introduced by Huang et al. in 1998 and has since been widely used in various fields, such as signal processing, image analysis, and biomedical engineering.

Advanced Analytics
Kevin Scott 0
Improving the detection of level shifts using the median filter

Time series data is widely used in various fields, such as finance, economics, and engineering. One of the key challenges when working with time series data is detecting level shifts. A level shift occurs when the time series’ mean and/or variance changes abruptly. These shifts can significantly impact the analysis and forecasting of the time series and must be detected and handled properly.

Advanced Analytics | Data for Good | Internet of Things
Larry Orimoloye 0
Scaling Internet of Things for dementia using particle filters

Dementia describes different brain disorders that trigger a loss of brain function. These conditions are all usually progressive and eventually severe. Alzheimer's disease is the most common type of dementia, affecting 62 percent of those diagnosed. Other types of dementia include; vascular dementia affecting 17 percent of those diagnosed, mixed

Rick Wicklin 0
Absorbing Markov chains in SAS

Last week I showed how to represent a Markov transition matrix in the SAS/IML matrix language. I also showed how to use matrix multiplication to iterate a state vector, thereby producing a discrete-time forecast of the state of the Markov chain system. This article shows that the expected behavior of

Rick Wicklin 0
Markov transition matrices in SAS/IML

Many computations in elementary probability assume that the probability of an event is independent of previous trials. For example, if you toss a coin twice, the probability of observing "heads" on the second toss does not depend on the result of the first toss. However, there are situations in which

Rick Wicklin 0
Create spaghetti plots in SAS

What is a spaghetti plot? Spaghetti plots are line plots that involve many overlapping lines. Like spaghetti on your plate, they can be hard to unravel, yet for many analysts they are a delicious staple of data visualization. This article presents the good, the bad, and the messy about spaghetti

Rick Wicklin 0
Compute a moving average in SAS

A common question on SAS discussion forums is how to compute a moving average in SAS. This article shows how to use PROC EXPAND and contains links to articles that use the DATA step or macros to compute moving averages in SAS. In a previous post, I explained how to

Learn SAS
Rick Wicklin 0
What is a moving average?

A moving average (also called a rolling average) is a statistical technique that is used to smooth a time series. Moving averages are used in finance, economics, and quality control. You can overlay a moving average curve on a time series to visualize how each value compares to a rolling

Rick Wicklin 0
Simulating a drunkard's walk in SAS

You've probably heard of a random walk, but have you heard about the drunkard's walk? I've previously written about how to simulate a one-dimensional random walk in SAS. In the random walk, you imagine a person who takes a series of steps where the step size and direction is a

1 2