 Time series machine learning techniques show great promise for the analysis of health care wearable data. As our busy lifestyles render continuous monitoring more and more essential, the need to analyze data to find correlations between these data streams becomes even more important, because they can provide important cues to people. These cues could be as simple as reminding a person to take a walk or move around, which is already being done by a lot of wearables available today, such as Fitbit, Garmin, Nike, etc. However, along with monitoring the current state of an individual, these popular devices are not able to perform the complex predictions that correlate the captured information to make sense at a higher level or provide causal relationships between the data. My research aims to develop advanced algorithms for analyzing time series data for estimation and prediction of physiological parameters (such as heart rate or respiration rate using kinematic and physiological data). My current work is applying time series machine learning techniques for greater insight.
I am currently a graduate student intern in machine learning at SAS and also a research assistant at the center for Advanced Self-Powered Systems of Integrated Sensors and Technologies (ASSIST) at North Carolina State University. The ASSIST Center is a National Science Foundation-sponsored Nanosystems Engineering Research Center (NERC), which means it develops and employs nanotechnology-enabled energy harvesting and storage, ultra-low power electronics, and sensors to create innovative, body-powered, and wearable health monitoring systems. SAS is one of the industry partners for the ASSIST Center, and the insights on real time data analysis from SAS have proven to be really helpful for our research. Our motivation behind this research can be explained through this simple example: suppose an individual has a pre-existing condition like asthma, where the surroundings and their activities could trigger an attack. In such cases predicting respiration rate in advance could be beneficial. For example, if s/he is biking and continues to bike for another 20 mins, his/her predicted respiration rate could help him/her decide if s/he should bike for another 20 mins or reduce the time to stay within healthy levels. The goal is to be able to notify people about these parameters by identifying the right activities, which then become an index to predict the physiological parameters. In my research, I address the problem of identifying activities by creating hierarchical models to learn robust parameters, which is one application of time series machine learning techniques. In the near future we will be able to use these models to then predict respiration rate and heart rate.
There have been numerous studies that make use of supervised learning for activity recognition, using motion capture data and inertial measurements obtained from inertial measurement units (IMU). An IMU is a device that measures and reports linear and angular motion from the body, and one widely-available example is a smartphone. Most of these studies make use of techniques such as feature extraction, clustering and machine learning approaches for classification. Feature extraction techniques range from using statistical moments of the data (e.g., mean, variance, kurtosis) to bag-of-words representations of poses and their temporal differences. Machine learning methods used include support vector machines (SVM), neural networks, and probabilistic graphical models (e.g., hidden Markov models and conditional random fields). There are also approaches using semi-supervised techniques, and even unsupervised techniques that rely on clustering user-defined similarity metrics to identify single activities. However, most of these approaches only work at a fixed scale. That is, they do not capture hierarchies in the activities, which are required to explain complex dependencies between activities. For example, a person’s arm swinging can be part of a simple activity, such as walking, or a complex activity, such as dancing. A two-level hierarchy has been captured through the computation of the so-called motifs that compose activities. Higher level hierarchies may also be essential but have not been carefully studied. The aim of this research is to capture these dependencies using a computationally efficient framework that will provide a robust characterization of the existing hierarchical structures.
Topological tools for high-dimensional data analysis have gained popularity in recent years. These techniques often focus on tracking the homology of a space, which is a group structure that carries information about its connectivity and number of holes. Techniques such as persistent homology have been used for the analysis of point cloud data, quantifying the stability of the features extracted in a computationally efficient way via the use of stability theorems. These techniques have been used in a variety of applications, including the study of shapes in protein, image analysis and speech pattern analysis. For this research project we use topological data analysis to find robust parameters and build hierarchical graphical representations to classify activities.
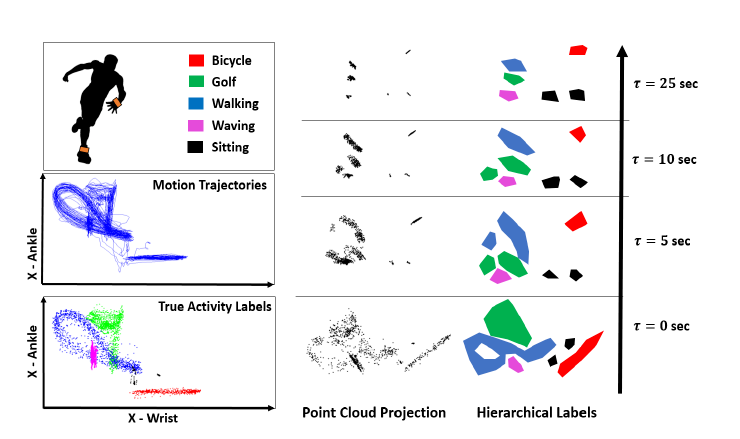 Our approach builds a hierarchical representation of the data streams by comparing segments of data over various window sizes. A graphical model is extracted by first clustering the segments over a fixed window size τ and then connecting clusters with sufficient overlap across τ values. The structure of the hierarchical graphical model depends on a clustering parameter ε. We propose a new methodology for selecting robust graphical structures from this data via the use of an aggregate version of the persistence diagram. We also provide a methodology for selecting parameter values for this representation based on inference performance and power consumption considerations.
From our approach we are able to report the prediction accuracy for each of the activities in our dataset (walking, bicycling, sitting, golfing and waving). We also show how persistence diagrams can help reduce computation time and help choose stable models for our hierarchical representations. Some of the future work will involve testing this method on other datasets and comparing it with other existing algorithms.
I personally am really excited about the advantages the wearable technologies provide us! They are changing the lifestyle of individuals at a personalized level. Coming from a biomedical background, I always wanted to work closely with the wearable devices and understand how they could benefit us to achieve a better and healthy living. Being able to apply time series machine learning techniques from my current studies in electrical engineering to health care wearables leverages my biomedical experience in exciting new ways!
I’ll be presenting this work as an e-poster during the SAS Analytics Experience Conference in Vegas September 12-14, 2016, so look for me if you’re there to learn more!
Editor’s note: Namita was one of six winners of the e-poster competition offered at the Conference, which meant she won a free trip to the event, so be sure to check out her work! This past summer Namita was also a SAS Summer Fellow in Machine Learning, which is a highly selective competitive program SAS offers for PhD students each year.