I recently wrote about how to overlay multiple curves on a single graph by reshaping wide data (with many variables) into long data (with a grouping variable). The implementation used PROC TRANSPOSE, which is a procedure in Base SAS.
When you program in the SAS/IML language, you might encounter data in a matrix with many columns that you need to reshape. The SAS/IML language provides several functions for reshaping data:
- The SHAPE function enables you to reshape the data in a matrix. The data are read in row-major order.
- To read the elements of a matrix in column-major order, use the SHAPECOL function.
- To replicate data (for the X and ID variable), use the REPEAT function.
In the PROC TRANSPOSE example, the data were reshaped by reading the data set in row-major order: The kth observation for the first variable is followed by the kth observation for the second, third, and fourth variables, and so forth. Consequently, the default behavior of the following WideToLong module is also to interleave the column values. However, the module also enables you to specify that the data should be stacked columnwise. That is, the reshaped data consists of all observations for the first variable, followed by all observations for the second variable, and so forth.
Some of the input variables might be numeric whereas others might be character, so the following module handles the X, Y, and grouping variables in separate matrices. The module returns three matrices: The long form of the Y matrix, the replicated X values, and the replicated grouping (or ID) variable. By convention, output variables are listed first in the argument list, as follows:
EDIT DEC2017: The WIDETOLONG subroutine is a built-in function in SAS/IML 14.3, released as part of SAS 9.4M5. If you are using a recent version of SAS, you can use the built-in function.
proc iml;
start WideToLong(OutY, OutX, OutG,                       /* output vars */
           Y, X=T(1:nrow(Y)), Group=1:ncol(Y), stack=0); /* input vars  */
   p = ncol(Y);
   N = nrow(Y);
   cX = colvec(X);
   cG = colvec(Group);
   if stack then do;         /* stack Y in column-major order  */
      OutY = shapecol(Y, 0, 1);        /* stack cols of Y      */
      OutX = repeat(cX, p);            /* replicate x          */
      OutG = colvec(repeat(cG, 1, N)); /* duplicate Group ID   */
   end;
   else do;      /* DEFAULT: interleave Y in row-major order   */
      OutY = shape(Y, 0, 1);           /* interleave cols of Y */
      OutX = colvec(repeat(cX, 1, p)); /* replicate x          */
      OutG = repeat(cG, N);            /* duplicate Group ID   */
   end;
finish; |
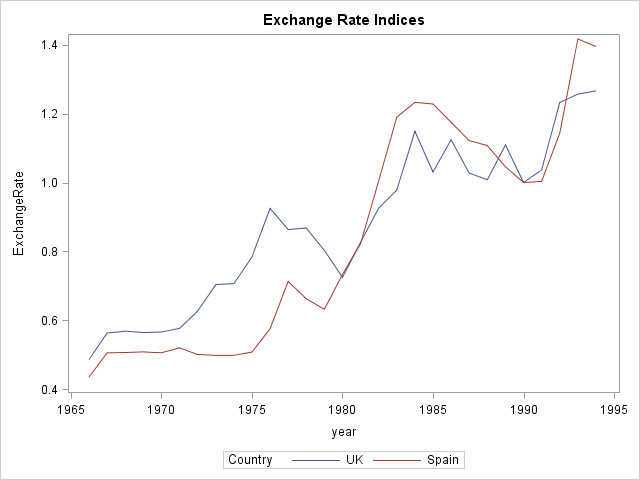
Let's see how the module works by testing it on the same data as in the previous blog post. For the Sashelp.Tourism data, each observation is a year in the range 1966–1994. The year is stored in a variable named Year. (Technical note: The Year data is stored as a SAS date value, so the example uses the YEAR function to convert the date value to an integer.) The exchange rates for the British pound and the Spanish peseta are stored in separate variables named ExUK and ExSp, respectively. The following statements read the data into SAS/IML matrices, and then convert the data from wide to long form by calling the WideToLong routine:
YNames = {ExUK ExSp};
GroupValues = {"UK" "Spain"};
XName = "Year";

use Sashelp.Tourism;
   read all var YNames into Y;
   read all var XName into X;
close Sashelp.Tourism;

/* For these data, X is a SAS date value. Convert to integer. */
X = year(X);
run WideToLong(ExchangeRate, Year, Country, /* output (long) */
Y, X, GroupValues); /* input (Y is wide) */ |
As shown in the previous blog post, a useful application of reshaping data is that it is easy to overlay multiple line plots on a single graph. In the SAS/IML language, the SERIES statement creates series plots and supports the GROUP= option for overlaying multiple lines. The following statement creates a time series of the two exchange rates between 1966 and 1994:
title "Exchange Rate Indices"; call series(Year, ExchangeRate) group=Country; |
By default, the data are reshaped in row-major order. To reshape in column-major order, specify the STACK=1 option, as follows:
run WideToLong(ExchangeRate, Year, Country, /* output (long) */
Y, X, GroupValues) stack=1; /* input (Y is wide) */ |

1 Comment
Pingback: Simulating a drunkard's walk in SAS - The DO Loop