Why are some dispersion statistics re-scaled?

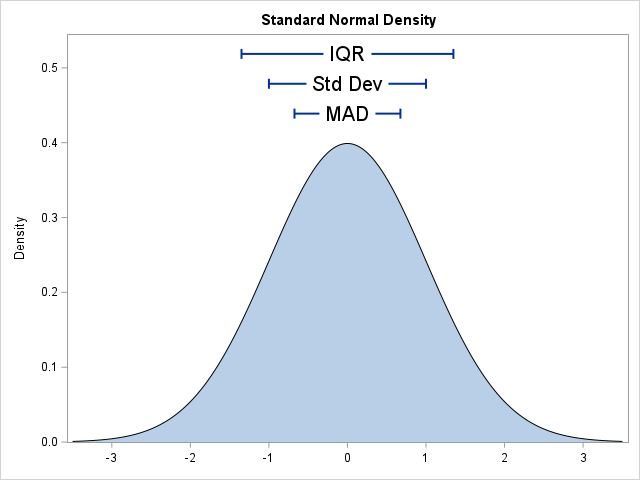
In statistics, the normal (Gaussian) distribution serves as a reference for many statistical quantities. For example, a normal distribution has excess kurtosis equal to zero, and other distributions are classified as leptokurtic (heavier-than-normal tails) or platykurtic (lighter-than-normal tails) in comparison. Similarly, the standard deviation of a normal distribution (σ) is