Numbers don't lie, but sometimes they don't reveal the full story. Last week I wrote about the most popular articles from The DO Loop in 2018. The popular articles are inevitably about elementary topics in SAS programming or statistics because those topics have broad appeal. However, I also write about advanced topics, which are less popular but fill an important niche in the SAS community. Not everyone needs to know how to fit a Pareto distribution in SAS or how to compute distance-based measures of correlation in SAS. Nevertheless, these topics are interesting to think about.
I believe that learning should not stop when we leave school. If you, too, are a lifelong learner, the following topics deserve a second look. I've included articles from four different categories.
Data Visualization
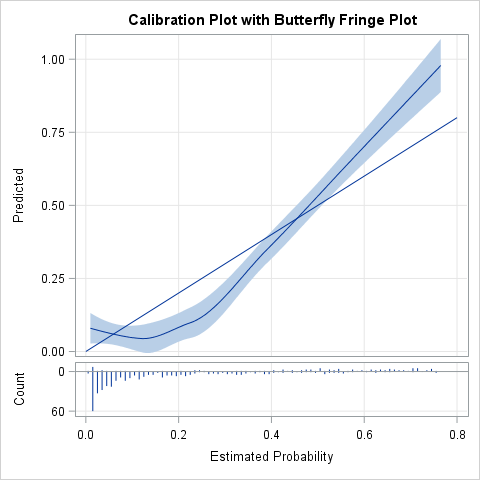
- Fringe plot: When fitting a logistic model, you can plot the predicted probabilities versus a continuous covariate or versus the empirical probability. You can use a fringe plot to overlay the data on the plot of predicted probabilities. The SAS developer of PROC LOGISTIC liked this article a lot, so look for fringe plots in a future release of SAS/STAT software!
- Order variables in a correlation matrix or scatter plot matrix: When displaying a graph that shows many variables (such as a scatter plot matrix), you can make the graph more understandable by ordering the variables so that similar variables are adjacent to each other. The article uses single-link clustering to order the variables, as suggested by Hurley (2004).
- Stacked band plot: You can use PROC SGPLOT to automatically create a stacked bar plot. However, when the bars represent an ordered categorical variable (such as months or years), you might want to create a stacked band plot instead. This article shows how to create a stacked band plot in SAS.

Statistics and Data Analysis
- The assumptions of linear regression: Some practicing statisticians get confused about the assumptions of least squares regression models. This article clarifies some misconceptions about linear regression and reviews which assumptions are necessary and which are optional.
- Which variables are in the final selected model?: Did you know that several regression procedures in SAS that support variable selection automatically produce a macro variable that contains the names of the selected variables? This can be very useful when working with large models in the GLMSELECT and QUANTSELECT procedures.
- The SWEEP operator: The SWEEP operator is a fundamental operator in linear algebra for statistics. The SWEEP operator is used for solving linear regression problems and it computes a generalized inverse when the explanatory variables have linear dependencies.
Random numbers and resampling methods
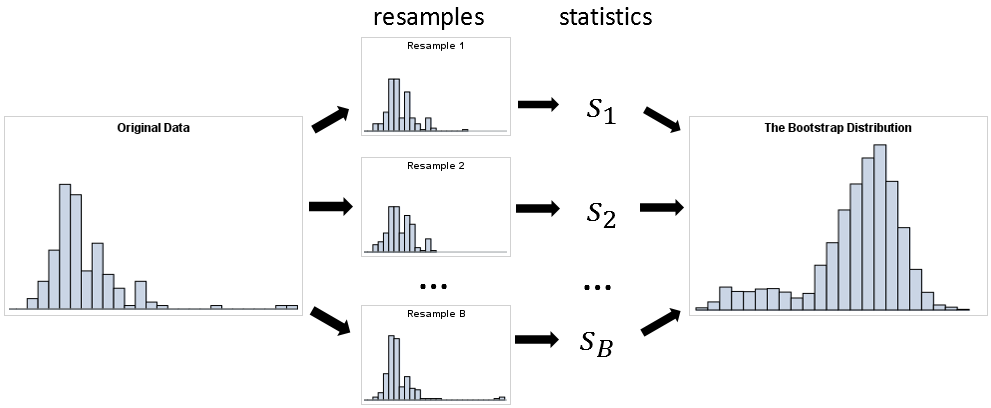
- The essential guide to bootstrapping: Do you use resampling methods such as the bootstrap? This article presents best practices and efficient methods to bootstrap computations in SAS.
- Independent streams of random numbers: If your program uses two or more SAS DATA steps to generate random numbers, or if you are generating random numbers in parallel, you need to make sure that each stream of independent numbers is independent. The new CALL STREAM subroutine enables you to generate independent streams of random numbers.
Optimization
- The initial guess problem: Many optimization algorithms require that you supply an initial guess for a solution, but often you will have no idea how to choose a good initial guess! Fortunately, several SAS procedures enable you to specify a grid of values; the best value from the grid is used to initialize the optimization.
- Solve a system of nonlinear equations: With the tips in this article, you can solve a system of k nonlinear equations in k unknowns.
These articles are technical but provide tips and techniques that you might find useful. Choose a few topics that are unfamiliar and teach yourself something new in this New Year!
Do you have a favorite article from 2018 that I did not include on the list? Share it in a comment!
