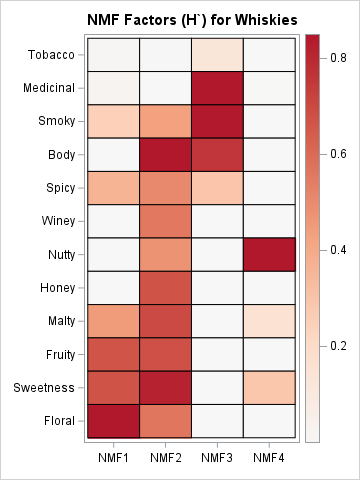
On discussion forums, many SAS programmers ask about the best way to generate dummy variables for categorical variables. Well-meaning responders offer all sorts of advice, including writing your own DATA step program, sometimes mixed with macro programming. This article shows that the simplest and easiest way to generate dummy variables
Tag: Statistical Programming
Have you ever seen the "brain teaser" for children that shows a 4 x 4 grid and asks "how many squares of any size are in this grid?" To solve this problem, the reader must recognize that there are sixteen 1 x 1 squares, nine 2 x 2 squares, four 3 x 3 squares, and one 4 x 4 square.
When you write a program that simulates data from a statistical model, you should always check that the simulation code is correct. One way to do this is to generate a large simulated sample, estimate the parameters in the simulated data, and make sure that the estimates are close to
Last month a SAS programmer asked how to fit a multivariate Gaussian mixture model in SAS. For univariate data, you can use the FMM Procedure, which fits a large variety of finite mixture models. If your company is using SAS Viya, you can use the MBC or GMM procedures, which
I recently showed how to compute within-group multivariate statistics by using the SAS/IML language. However, a principal of good software design is to encapsulate functionality and write self-contained functions that compute and return the results. What is the best way to return multiple statistics from a SAS/IML module? A convenient
The multivariate normal distribution is used frequently in multivariate statistics and machine learning. In many applications, you need to evaluate the log-likelihood function in order to compare how well different models fit the data. The log-likelihood for a vector x is the natural logarithm of the multivariate normal (MVN) density
A previous article discusses the pooled variance for two or groups of univariate data. The pooled variance is often used during a t test of two independent samples. For multivariate data, the analogous concept is the pooled covariance matrix, which is an average of the sample covariance matrices of the
If you have ever run a Kolmogorov-Smirnov test for normality, you have encountered the Kolmogorov D statistic. The Kolmogorov D statistic is used to assess whether a random sample was drawn from a specified distribution. Although it is frequently used to test for normality, the statistic is "distribution free" in
If you have been learning about machine learning or mathematical statistics, you might have heard about the Kullback–Leibler divergence. The Kullback–Leibler divergence is a measure of dissimilarity between two probability distributions. It measures how much one distribution differs from a reference distribution. This article explains the Kullback–Leibler divergence and shows
A SAS/IML programmer asked about the best way to print multiple SAS/IML variables when each variable needs a different format. He wanted the output to resemble the "Parameter Estimates" table that is produced by PROC REG and other SAS/STAT procedures. This article shows four ways to print SAS/IML vectors in
Books about statistics and machine learning often discuss the tradeoff between bias and variance for an estimator. These discussions are often motivated by a sophisticated predictive model such as a regression or a decision tree. But the basic idea can be seen in much simpler situations. This article presents a
In a previous article, I discussed the binormal model for a binary classification problem. This model assumes a set of scores that are normally distributed for each population, and the mean of the scores for the Negative population is less than the mean of scores for the Positive population. I
Suppose that a data set contains a set of parameter values. For each row of parameters, you need to perform some computation. A recent discussion on the SAS Support Communities mentions an important point: if there are duplicate rows in the data, a program might repeat the same computation several
The ROC curve is a graphical method that summarizes how well a binary classifier can discriminate between two populations, often called the "negative" population (individuals who do not have a disease or characteristic) and the "positive" population (individuals who do have it). As shown in a previous article, there is
Are you a statistical programmer whose company has adopted SAS Viya? If so, you probably know that the DATA step can run in parallel in SAS Cloud Analytic Services (CAS). As Sekosky (2017) says, "running in a single thread in SAS is different from running in many threads in CAS."
The Johnson system (Johnson, 1949) contains a family of four distributions: the normal distribution, the lognormal distribution, the SB distribution (which models bounded distributions), and the SU distribution (which models unbounded distributions). Note that 'B' stands for 'bounded' and 'U' stands for 'unbounded.' A previous article explains the purpose of
From the early days of probability and statistics, researchers have tried to organize and categorize parametric probability distributions. For example, Pearson (1895, 1901, and 1916) developed a system of seven distributions, which was later called the Pearson system. The main idea behind a "system" of distributions is that for each
What is an efficient way to evaluate a multivariate quadratic polynomial in p variables? The answer is to use matrix computations! A multivariate quadratic polynomial can be written as the sum of a purely quadratic term (degree 2), a purely linear term (degree 1), and a constant term (degree 0).
The EFFECT statement is supported by more than a dozen SAS/STAT regression procedures. Among other things, it enables you to generate spline effects that you can use to fit nonlinear relationships in data. Recently there was a discussion on the SAS Support Communities about how to interpret the parameter estimates
I frequently see questions on SAS discussion forums about how to compute the geometric mean and related quantities in SAS. Unfortunately, the answers to these questions are sometimes confusing or even wrong. In addition, some published papers and web sites that claim to show how to calculate the geometric mean
An important application of the dot product (inner product) of two vectors is to determine the angle between the vectors. If u and v are two vectors, then cos(θ) = (u ⋅ v) / (|u| |v|) You could apply the inverse cosine function if you wanted to find θ in
Most SAS programmers know how to use PROC APPEND or the SET statement in DATA step to unconditionally append new observations to an existing data set. However, sometimes you need to scan the data to determine whether or not to append observations. In this situation, many SAS programmers choose one
One of my friends likes to remind me that "there is no such thing as a free lunch," which he abbreviates by "TINSTAAFL" (or TANSTAAFL). The TINSTAAFL principle applies to computer programming because you often end up paying a cost (in performance) when you call a convenience function that simplifies
Many programmers are familiar with "short-circuit" evaluation in an IF-THEN statement. Short circuit means that a program does not evaluate the remainder of a logical expression if the value of the expression is already logically determined. The SAS DATA step supports short-circuiting for simple logical expressions in IF-THEN statements and
Sometimes a little thing can make a big difference. I am enjoying a new enhancement of SAS/IML 15.1, which enables you to use a numeric vector as the column header or row header when you print a SAS/IML matrix. Prior to SAS/IML 15.1, you had to use the CHAR or
SAS supports more than 25 common probability distributions for the PDF, CDF, QUANTILE, and RAND functions. Of course, there are infinitely many distributions, so not every possible distribution is supported. If you need a less-common distribution, I've shown how to extend the functionality of Base SAS (by using PROC FCMP)
SAS/STAT software contains a number of so-called HP procedures for training and evaluating predictive models. ("HP" stands for "high performance.") A popular HP procedure is HPLOGISTIC, which enables you to fit logistic models on Big Data. A goal of the HP procedures is to fit models quickly. Inferential statistics such
Recently I wrote about how to compute the Kolmogorov D statistic, which is used to determine whether a sample has a particular distribution. One of the beautiful facts about modern computational statistics is that if you can compute a statistic, you can use simulation to estimate the sampling distribution of
Have you ever run a statistical test to determine whether data are normally distributed? If so, you have probably used Kolmogorov's D statistic. Kolmogorov's D statistic (also called the Kolmogorov-Smirnov statistic) enables you to test whether the empirical distribution of data is different than a reference distribution. The reference distribution
SAS regression procedures support several parameterizations of classification variables. When a categorical variable is used as an explanatory variable in a regression model, the procedure generates dummy variables that are used to construct a design matrix for the model. The process of forming columns in a design matrix is called