In 2025, I wrote about 60 articles for The DO Loop blog. My most popular articles were about SAS programming, data visualization, and statistics. This blog post lists some of the most popular articles from 2025. Read on for the Reader's Choice Awards in various categories!
SAS Programming
The following articles discuss SAS programming techniques:
- Strengthen your SAS skills with the WEEK function: The WEEK function in SAS returns a week number for every date. This is extremely useful if you want to report or analyze data by weeks.
- Use the hyphen and colon operators to specify multiple data sets on the SET statement: Many SAS programmers know that you can use list operators specify a list of variables in SAS procedures, especially on the WHERE, KEEP, DROP, VAR, and MODEL statements. But did you know that you can use the hyphen operator and the colon operator to specify lists of data sets on the SET statement in the DATA step?
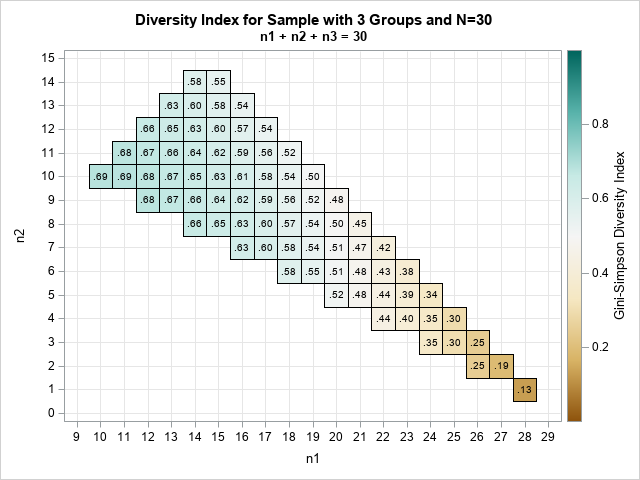
- Calculate the Gini-Simpson diversity index in SAS: The US Census Bureau adopted a new statistical measure of diversity called the Gini-Simpson diversity index. This blog post shows how to compute the Gini-Simpson diversity index in SAS.
Data Visualization
The following articles discuss statistical graphics or data visualization:
- Visualize the Gini-Simpson diversity index: The Gini-Simpson diversity index (see the article in the previous section) is a measure of the diversity of a sample that has several groups. It is largest when all groups are similarly sized. It is smallest when there is one large group, and the other groups all have one observation. This article visualizes the Gini-Simpson index.
- Nested bar charts in SAS: This article shows how to use the Graph Template Language (GTL) to create a nested side-by-side bar chart. In a nested bar chart, the same data is shown by overlaying two bar charts, such as sales for each quarter overlaid on a bar chart of sales by year. Although many analysts use a stacked bar chart for this purpose, sometimes a side-by-side bar chart is useful.
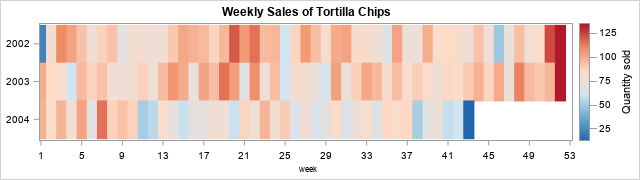
- Use a lasagna plot to visualize US gas prices: A lasagna plot is a heat map that uses rows and columns to visualize data, especially time series. This article uses SAS (and the WEEK function) to visualize US gasoline prices from 1990 to the present in a way that makes it easy to observe seasonality and global events that affect prices.
Statistics and data analysis
The following articles discuss statistical techniques:
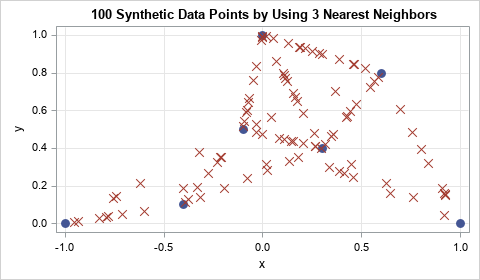
- The SMOTE method for generating synthetic data: Synthetic data was big in 2025, with SAS introducing products for generating synthetic data and modeling complex scenarios by using digital twins. A popular nonparametric method for generating simulating new data from an existing data set is to use the SMOTE method. I always say that if you are going to use a method, you should try to understand it, so I wrote a beginner-friendly article that describes how the SMOTE algorithm works.
- Stratified bootstrapping and when to use it: If you are bootstrapping data that has a classification sample, the number of observations in each class will vary among bootstrap samples. For some statistical analyses, it is better to ensure that the number of observations in each class is the same for all bootstrap samples. In that case, you should use a stratified bootstrap sample.
- Cohen's D statistic in SAS: Cohen's d statistic is sometimes called the standardized mean difference (SMD). This article shows how to compute Cohen's d statistic (and its standard error) in SAS for a two-sample independent (unpaired) t test.
The Top Article of 2025
By far, the most popular article in 2025 was a short article about the history of a popular statistical quote. A drum roll, please!
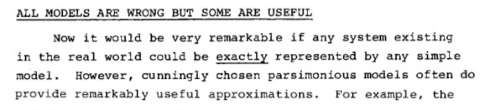
- Did George Box say, "All models are wrong, but some are useful"?: This article summarizes my research into the famous quote by George Box, "All models are wrong, but some are useful." I was able to locate the quote on p. 424 of Box and Draper (1987). A reader pointed out that the quote also appears in a hard-to-find conference proceedings from 1978, which I was eventually able to obtain.
Summary
Did you make a New Year's resolution to learn something new this year? Choose one of these articles and start learning!

3 Comments
I think the article with the following title
"Top 10 posts from The DO Loop in 2024"
was in the top 10 in 2025. Wasn't it?
Anyway ... I always think those retrospective articles are really cool.
Correct: last year's "Top Ten" post was one of the most popular posts in 2025. I excluded it so I could focus on new content.
Pingback: 12 blog posts from 2025 that deserve a second look - The DO Loop