Many SAS procedures support the BY statement, which enables you to perform an analysis for subgroups of the data set. Although the SAS/IML language does not have a built-in "BY statement," there are various techniques that enable you to perform a BY-group analysis. The two I use most often are the UNIQUE-LOC technique and the UNIQUEBY technique. The first is more intuitive, the second is more efficient. This article shows how to use SAS/IML to read and process BY-group data from a data set.
I previously showed that you can perform BY-group processing in SAS/IML by using the UNIQUEBY technique, so this article uses the UNIQUE-LOC technique. The statistical application is simulating clusters of data. If you have a SAS data set that contains the centers and covariance matrices for several groups of observations, you can then read that information into SAS/IML and simulate new observations for each group by using a multivariate normal distribution.
Matrix operations and BY groups
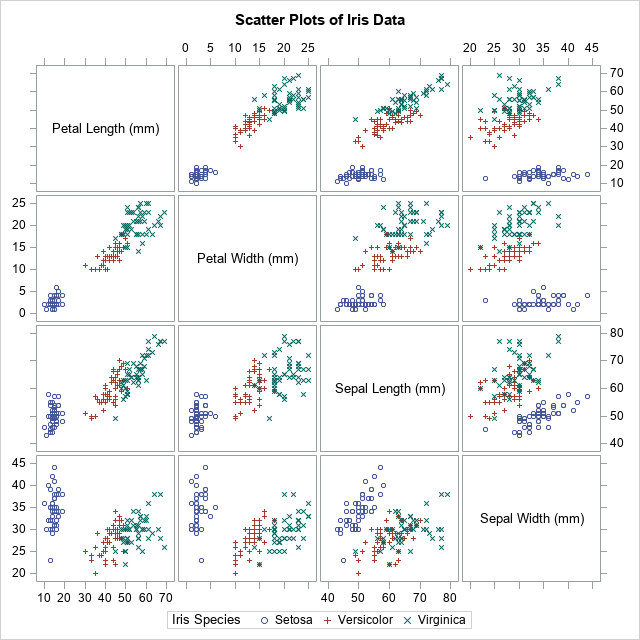
A BY-group analysis in SAS/IML usually starts with a SAS data set that contains a bunch of covariance or correlation matrices. A simple example is a correlation analysis of each species of flower in Fisher's iris data set. The BY-group variable is the species of iris: Setosa, Versicolor, or Virginica. The variables are measurements (in mm) of the sepals and petals of 150 flowers, 50 from each species. A panel of scatter plots for the iris data is shown to the right. You can see that the three species appear to be clustered. From the shapes of the clusters, you might decide to model each cluster by using a multivariate normal distribution.
You can use the OUTP= and COV options in PROC CORR to output mean and covariance statistics for each group, as follows:
proc corr data=sashelp.iris outp=CorrOut COV noprint; by Species; var Petal: Sepal:; run; proc print data=CorrOut(where=(_TYPE_ in ("N", "MEAN", "COV"))) noobs; where Species="Setosa"; /* just view information for one group */ by Species _Type_ notsorted; var _NAME_ Petal: Sepal:; run; |
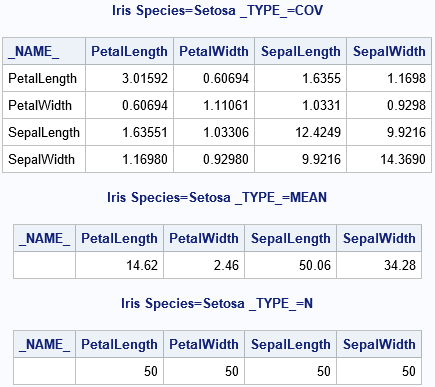
The statistics for one of the groups (Species='Setosa') are shown. The number of observations in the group (N) is actually a scalar value, but it was replicated to fit into a rectangular data set.
Reading BY-group information into SAS/IML
This section reads the sample size, mean vector, and covariance matrix for all groups. A WHERE clause selects only the observations of interest:
/* Read in N, Mean, and Cov for each species. Use to create a parametric bootstrap by simulating N[i] observations from a MVN(Mean[i], Cov[i]) distribution */ proc iml; varNames = {'PetalLength' 'PetalWidth' 'SepalLength' 'SepalWidth'}; use CorrOut where (_TYPE_="N" & Species^=" "); /* N */ read all var varNames into mN[rowname=Species]; /* read for all groups */ print mN[c=varNames]; use CorrOut where (_TYPE_="MEAN" & Species^=" "); /* mean */ read all var varNames into mMean[rowname=Species]; /* read for all groups */ print mMean[c=varNames]; use CorrOut where (_TYPE_="COV" & Species^=" "); /* covariance */ read all var varNames into mCov[rowname=Species]; /* read for all groups */ close; print mCov[c=varNames]; |
The output (not shown) shows that the matrices mN, mMean, and mCov contain the vertical concatenation (for all groups) of the sample size, mean vectors, and covariance matrices, respectively.
The grouping variable is Species. You can use the UNIQUE function to get the unique (sorted) values of the groups. You can then iterate over the unique values and use the LOC function to extract only the rows of the matrices that correspond to the ith group. What you do with that information depends on your application. In the following program, the information for each group is used to create a random sample from a multivariate normal distribution that has the same size, mean, and covariance as the ith group:
/* Goal: Write random MVN values in X to data set */ X = j(1, ncol(varNames), .); /* X variables will be numeric */ Spec = BlankStr(nleng(Species)); /* and Spec will be character */ create SimOut from X[rowname=Spec colname=varNames]; /* open for writing */ /* The BY-group variable is Species */ call randseed(12345); u = unique(Species); /* get unique values for groups */ do i = 1 to ncol(u); /* iterate over unique values */ idx = loc(Species=u[i]); /* rows for the i_th group */ N = mN[i, 1]; /* extract scalar from i_th group */ mu = mMean[i,]; /* extract vector from i_th group */ Sigma = mCov[idx,]; /* extract matrix from i_th group */ /* The parameters for this group are now in N, mu, and Sigma. Do something with these values. */ X = RandNormal(N, mu, Sigma); /* simulate obs for the i_th group */ X = round(X); /* measure to nearest mm */ Spec = j(N, 1, u[i]); /* ID for this sample */ append from X[rowname=Spec]; end; close SimOut; quit; ods graphics / attrpriority=none; title "Parametric Bootstrap Simulation of Iris Data"; proc sgscatter data=SimOut(rename=(Spec=Species)); matrix Petal: Sepal: / group=Species; run; |
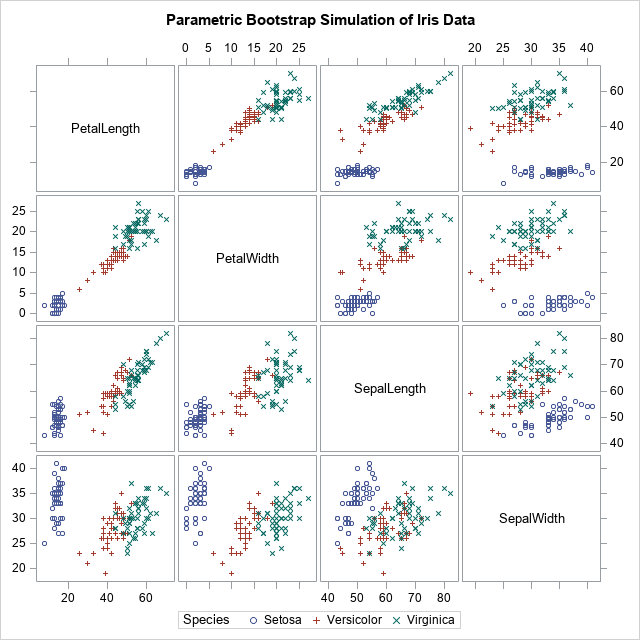
The simulation has generated a new set of clustered data. If you compare the simulated data with the original, you will notice many statistical similarities.
Although the main purpose of this article is to discuss BY-group processing in SAS/IML, I want to point out that the simulation in this article is an example of the parametric bootstrap. Simulating Data with SAS (Wicklin, 2013) states that "the parametric bootstrap is nothing more than the process of fitting a model distribution to the data and simulating data from the fitted model." That is what happens in this program. The sample means and covariance matrices are used as parameters to generate new synthetic observations. Thus, the parametric bootstrap technique is really a form of simulation where the parameters for the simulation are obtained from the data.
In conclusion, sometimes you have many matrices in a SAS data set, each identified by a categorical variable. You can perform "BY-group processing" in SAS/IML by reading in all the matrices into a big matrix and then use the UNIQUE-LOC technique to iterate over each matrix.
