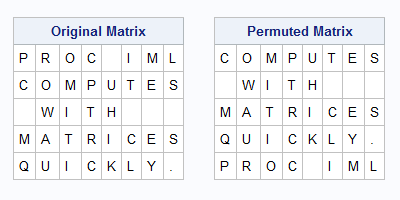
A previous post discusses how the loess regression algorithm is implemented in SAS. The LOESS procedure in SAS/STAT software provides the data analyst with options to control the loess algorithm and fit nonparametric smoothing curves through points in a scatter plot. Although PROC LOESS satisfies 99.99% of SAS users who
Tag: Statistical Programming
Although statisticians often assume normally distributed errors, there are important processes for which the error distribution has a heavy tail. A well-known heavy-tailed distribution is the t distribution, but the t distribution is unsuitable for some applications because it does not have finite moments (means, variance,...) for small parameter values.
A kernel density estimate (KDE) is a nonparametric estimate for the density of a data sample. A KDE can help an analyst determine how to model the data: Does the KDE look like a normal curve? Like a mixture of normals? Is there evidence of outliers in the data? In
Graphs enable you to visualize how the predicted values for a regression model depend on the model effects. You can gain an intuitive understanding of a model by using the EFFECTPLOT statement in SAS to create graphs like the one shown at the top of this article. Many SAS regression
SAS software can fit many different kinds of regression models. In fact a common question on the SAS Support Communities is "how do I fit a <name> regression model in SAS?" And within that category, the most frequent questions involve how to fit various logistic regression models in SAS. There
Last week I showed how to use PROC EXPAND to compute moving averages and other rolling statistics in SAS. Unfortunately, PROC EXPAND is part of SAS/ETS software and not every SAS site has a license for SAS/ETS. For simple moving averages, you can write a DATA step program, as discussed
In SAS, the aspect ratio of a graph is the physical height of the graph divided by the physical width. Recently I demonstrated how to set the aspect ratio of graphs in SAS by using the ASPECT= option in PROC SGPLOT or by using the OVERLAYEQUATED statement in the Graph
I began 2016 by compiling a list of popular articles from my blog in 2015. This "People's Choice" list contains many interesting articles, but some of my personal favorites did not make the list. Today I present the "Editor's Choice" list of articles that deserve a second look. I've grouped
A matrix is a convenient way to store an array of numbers. However, often you need to extract certain elements from a matrix. The SAS/IML language supports two ways to extract elements: by using subscripts or by using indices. Use subscripts when you are extracting a rectangular portion of a
Sometimes I can't remember where I put things. If I lose my glasses or garden tools, I am out of luck. But when I can't remember where I put some data, I have SAS to help me find it. When I can remember the name of the data set, my
Did you know that the FREQ procedure in SAS can compute exact p-values for more than 20 statistical tests and statistics that are associated with contingency table? Mamma mia! That's a veritable smorgasbord of options! Some of the tests are specifically for one-way tables or 2 x 2 tables, but many apply
A friend who teaches courses about statistical regression asked me how to create a graph in SAS that illustrates an important concept: the conditional distribution of the response variable. The basic idea is to draw a scatter plot with a regression line, then overlay several probability distributions along the line,
Imagine the following scenario. You have many data sets from various sources, such as individual stores or hospitals. You use the SAS DATA step to concatenate the many data sets into a single large data set. You give the big data set to a colleague who will analyze it. Later
SAS/IML software is used by many SAS programmers, primarily for creating custom algorithms and macros that implement statistical analyses that are not built into any SAS procedure. I know that PROC IML is used regularly by pharmaceutical companies, by the financial and insurance industries, and by researchers in medical colleges
One of the fundamental principles of computer programming is to break a task into smaller subtasks and to modularize the program by encapsulating each subtask into its own function. I have written many blog posts over the years about how to define and use functions in the SAS/IML language. I
A feature of SAS/IML 13.2 (shipped with SAS 9.4m2, Aug 2014) is the ability to execute SAS/IML statements that are in a file. The feature is implemented by the new EXECUTEFILE subroutine. This feature is similar to the CALL EXECUTE statement. The difference is that the EXECUTEFILE subroutine reads, parses,
A common task in data analysis is to locate observations that satisfy multiple criteria. For example, you might want to locate all zip codes in certain counties within specified states. The SAS DATA step contains the powerful WHERE statement, which enables you to extract a subset of data that satisfy
A customer asked: How do we go about summing a finite series in SAS? For example, I want to compute for various integers n ≥ 3. I want to output two columns, one for the natural numbers and one for the summation of the series. Summations arise often in statistical
The title of this article makes no sense. How can the number of elements (in fact, the number of anything!) not be a whole number? In fact, it can't. However, the title refers to the fact that you might compute a quantity that ought to be an integer, but is
Sometimes I get contacted by SAS/IML programmers who discover that the SAS/IML language does not provide built-in support for multiplication of matrices that have missing values. (SAS/IML does support elementwise operations with missing values.) I usually respond by asking what they are trying to accomplish, because mathematically matrix multiplication with
SAS procedures usually handle missing values automatically. Univariate procedures such as PROC MEANS automatically delete missing values when computing basic descriptive statistics. Many multivariate procedures such as PROC REG delete an entire observation if any variable in the analysis has a missing value. This is called listwise deletion or using
The SAS DATA step supports multidimensional arrays. However, matrices in SAS/IML are like mathematical matrices: they are always two dimensional. In simulation studies you might need to generate and store thousands of matrices for a later statistical analysis of their properties. How can you accomplish that unless you can create
In SAS, the order of variables in a data set is usually unimportant. However, occasionally SAS programmers need to reorder the variables in order to make a special graph or to simplify a computation. Reordering variables in the DATA step is slightly tricky. There are Knowledge Base articles about how
A SAS/IML programmer asked a question on a discussion forum, which I paraphrase below: I've written a SAS/IML function that takes several arguments. Some of the arguments have default values. When the module is called, I want to compute some quantity, but I only want to compute it for the
A SAS programmer recently posted a question to the SAS/IML Support Community about how to compute the kth smallest value in a vector of numbers. In the DATA step, you can use the SMALLEST function to find the smallest value in an array, but there is no equivalent built-in function
Like most programming languages, the SAS/IML language has many functions. However, the SAS/IML language also has quite a few operators. Operators can act on a matrix or on rows or columns of a matrix. They are less intuitive, but can be quite powerful because they enable you perform computations without
A common question on SAS discussion forums is how to compute the minimum and maximum values across several variables. It is easy to compute statistics across rows by using the DATA step. This article shows how to compute the minimum and maximum values for each observation (across variables) and, for
SAS/IML 13.1 includes a handy function for programmers who write a lot of modules. The PARENTNAME function obtains the name of the symbol that was passed in as a parameter to a user-defined module. How is this useful? Well, suppose that you want to create a SAS/IML module that prints
In a previous blog post, I described how to generate combinations in SAS by using the ALLCOMB function in SAS/IML software. The ALLCOMB function in Base SAS is the equivalent function for DATA step programmers. Recall that a combination is a unique arrangement of k elements chosen from a set
Have you written a SAS/IML program that you think is particularly clever? Are you the proud author of SAS/IML functions that extend the functionality of SAS software? You've worked hard to develop, debug, and test your program, so why not share it with others? There is now a location for