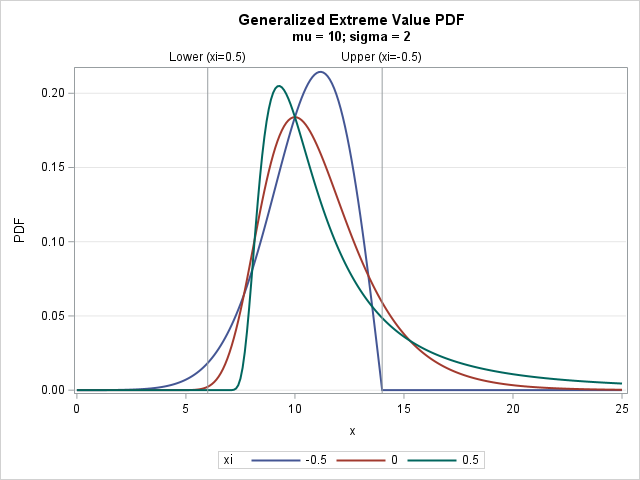
The TV show Cheers was set in a bar "where everybody knows your name." Global knowledge of a name is appealing for a neighborhood pub, but not for a programming language. Most programming languages enable you to define functions that have local variables: variables whose names are known only inside
Tag: Statistical Programming
I've previously described how to overlay two or more density curves on a single plot. I've also written about how to use PROC SGPLOT to overlay custom curves on a graph. This article describes how to overlay a density curve on a histogram. For common distributions, you can overlay a
ODS statements are global SAS statements. As such, you can put them anywhere in your SAS program. For maximum readability, many SAS programmers agree that most ODS statements should appear outside procedures in "open" SAS code. For example, most programmers agree that the following statements should appear outside of procedures:
In statistics, distances between observations are used to form clusters, to identify outliers, and to estimate distributions. Distances are used in spatial statistics and in other application areas. There are many ways to define the distance between observations. I have previously written an article that explains Mahalanobis distance, which is
Someone recently asked a question on the SAS Support Communities about estimating parameters in ridge regression. I answered the question by pointing to a matrix formula in the SAS documentation. One of the advantages of the SAS/IML language is that you can implement matrix formulas in a natural way. The
Argh! I've just spilled coffee on output that shows the least squares coefficients for a regression model that I was investigating. Now the parameter estimate for the intercept is completely obscured, although I can still see the parameter estimates for the coefficients of the continuous explanatory variable. What can I
Last week there was an interesting question posted to the "Stat-Math Statistics" group on LinkedIn. The original question was a little confusing, so I'll state it in a more general form: A population is normally distributed with a known mean and standard deviation. A sample of size N is drawn
Last week the SAS Training Post blog posted a short article on an easy way to find variables in common to two data sets. The article used PROC CONTENTS (with the SHORT option) to print out the names of variables in SAS data sets so that you can visually determine
A while ago I saw a blog post on how to simulate Bernoulli outcomes when the probability of generating a 1 (success) varies from observation to observation. I've done this often in SAS, both in the DATA step and in the SAS/IML language. For example, when simulating data that satisfied
It's the start of a new year. Have you made a resolution to be a better data analyst? A better SAS statistical programmer? To learn more about multivariate statistics? What better way to start the New Year than to read (or re-read!) the top 12 articles for statistical programmers from
Frequently someone will post a question to the SAS Support Community that says something like this: I am trying to do [statistical task]and SAS issues an error and reports that my correlation matrix is not positive definite. What is going on and how can I complete [the task]? The statistical
The other day I was constructing covariance matrices for simulating data for a mixed model with repeated measurements. I was using the SAS/IML BLOCK function to build up the "R-side" covariance matrix from smaller blocks. The matrix I was constructing was block-diagonal and looked like this: The matrix represents a
The determinant of a matrix arises in many statistical computations, such as in estimating parameters that fit a distribution to multivariate data. For example, if you are using a log-likelihood function to fit a multivariate normal distribution, the formula for the log-likelihood involves the expression log(det(Σ)), where Σ is the
Last week I wrote a SAS/IML program that computes the odds of winning the game of craps. I noted that the program remains valid even if the dice are not fair. For convenience, here is a SAS/IML function that computes the probability of winning at craps, given the probability vector
Gambling games that use dice, such as the game of "craps," are often used to demonstrate the laws of probability. For two dice, the possible rolls and probability of each roll are usually represented by a matrix. Consequently, the SAS/IML language makes it easy to compute the probabilities of various
I was recently flipping through Ross' Simulation (2006, 4th Edition) and saw the following exercise: Let N be the minimum number of draws from a uniform distribution [until the sum of the variates]exceeds 1. What is the expected value of N? Write a simulation to estimate the expected value. For
Sometimes it is useful to group observations based on the values of some variable. Common schemes for grouping include binning and using quantiles. In the binning approach, a variable is divided into k equal intervals, called bins, and each observation is assigned to a bin. In this scheme, the size
If you use a word three times, it's yours. -Unknown When I was a child, my mother used to encourage me to increase my vocabulary by saying, "If you use a word three times, it's yours for life." I believe that the same saying holds for programming techniques: Use a
Ah! The joys of sets! It is easy to test whether two vectors are equal in SAS/IML software. It is only slightly more challenging to test whether two sets are equal. Recall that A and B are equal as sets if they contain the same elements. Order does not matter.
The SAS/IML language supports user-defined functions (also called modules). Many SAS/IML programmers know that you can use the RETURN function to return a value from a user-defined function. For example, the following function returns the sum of each column of matrix: proc iml; start ColSum(M); return( M[+, ] ); /*
It is common to want to extract the lower or upper triangular elements of a matrix. For example, if you have a correlation matrix, the lower triangular elements are the nontrivial correlations between variables in your data. As I've written before, you can use the VECH function to extract the
When you are working with probability distributions (normal, Poisson, exponential, and so forth), there are four essential functions that a statistical programmer needs. As I've written before, for common univariate distributions, SAS provides the following functions: the PDF function, which returns the probability density at a given point the CDF
Suppose that you have two data vectors, x and y, with the same number of elements. How can you rearrange the values of y so that they have the same relative order as the values of x? In other words, find a permutation, π, of the elements of y so
I've been working on a new book about Simulating Data with SAS. In researching the chapter on simulation of multivariate data, I've noticed that the probability density function (PDF) of multivariate distributions is often specified in a matrix form. Consequently, the multivariate density can usually be computed by using the
I often use the SAS/IML language for simulating data with certain known properties. In fact, I'm writing a book called Simulating Data with SAS. When I simulate repeated measurements (sometimes called replicated data), I often want to generate an ID variable that identifies which measurement is associated with which subject
A reader wrote for help with a computational problem. He has a vector of length N and the vector contains integer values in the range [1, 120], which represent months for which events occurred over a 10-year period. The question is: what is the 24-month period for which the most
In the SAS/IML language, a user-defined function or subroutine is called a module. Modules are used to extend the capability of the SAS/IML language. Usually you need to explicitly load modules before you use them, but there are two cases where PROC IML loads a module automatically. Modules in IMLMLIB
In a previous blog, I showed how to use SAS/IML subscript reduction operators to compute the location of the maximum values for each row of a matrix. The subscript reduction operators are useful for computing simple statistics for each row (or column) of a numerical matrix. If x is a
When I was at SAS Global Forum last week, a SAS user asked my advice regarding a SAS/IML program that he wrote. One step of the program was taking too long to run and he wondered if I could suggest a way to speed it up. The long-running step was
In statistical programming, I often test a program by running it on a problem for which I know the correct answer. I often use a single expression to compute the maximum value of the absolute difference between the vectors: maxDiff = max( abs( z-correct ) ); /* largest absolute difference