In 2024, I wrote about 80 articles for The DO Loop blog. My most popular articles were about SAS programming, data visualization, and statistics. If you missed any of these articles, here is the "Reader's Choice Awards" for some of the most popular articles from 2024!
SAS Programming
The following articles discuss SAS programming techniques:

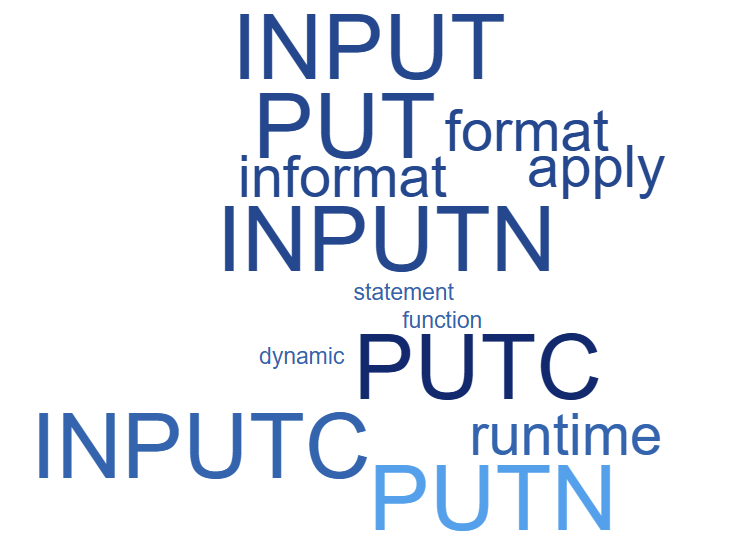
- Understand the PUT and INPUT functions: This article describes when and how to use the INPUT and PUT functions in SAS. The INPUT and PUT functions are powerful functions that enable you to convert data from character type to numeric type and vice versa. Spoiler: the INPUT function applies an informat, whereas the PUT function applies a format. You cannot fully understand the PUT and INPUT functions without understanding formats and informats in SAS.
- Find the label of a variable: Did you know that there are DATA step functions in SAS that get the attributes of variables? This article shows how to use the VLABEL function in a SAS DATA step to get the label for a variable. Similar functions exist to get other variable attributes, such as formats (VFORMAT), type (VTYPE), and name (VNAME).
- Find the name of the variable that contains the largest value in each row: This article shows three tips for using SAS arrays. You can use the OF operator (sometimes called the OF keyword) to specify that the elements of an array should be used as arguments to a function. Use the WHICHN function to return the index of the (first) value in the array that matches a specified value. Use the VARNAME function to return a string that contains the name of a variable in an array.
- How SAS displays missing values: This article shows two ways to control how SAS displays missing values. In a follow-up article, I discuss three special missing values that appear in ODS tables that appear in SAS statistical procedures.
Data Visualization

Creating effective statistical graphics requires a life-long commitment to learning. Improve your DataViz skills with these top tips from last year:
- 10 tips for creating effective statistical graphics: Not only was this "10 tips for graphics" compilation article one of my most popular blog posts, but I presented the content at multiple SAS-related conferences across the country. Reach out to me if your group wants to hear this presentation.
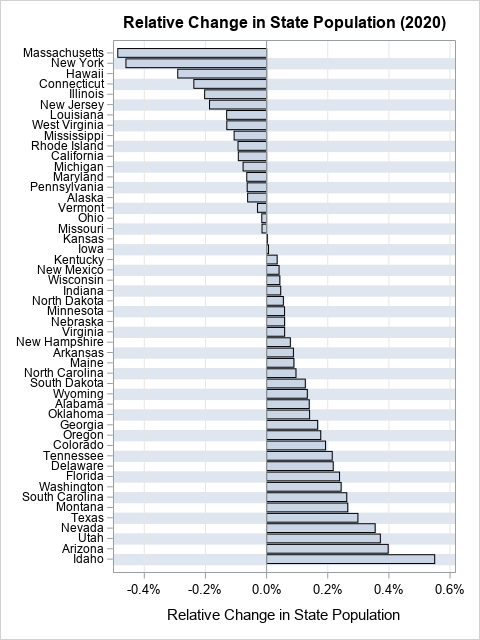
- Use colors to visualize groups in a bar chart: If you want to be an expert in SAS statistical graphics, this article discusses a few powerful tricks and techniques: formats that discretize a continuous variable, color ramps that contains perceptually balanced colors, and discrete attribute maps, which assign colors to group levels.
- Visualize patterns of missing values: his article shows how to use Base SAS procedures to create a heat map that reveals patterns of missing values in data.
Statistics and data analysis

Technical blog posts do not always generate large readership numbers. Not everyone has the need to read about some complicated calculation of an esoteric statistic. But three statistical topics that reliably generate interest are correlation, regression, and confidence intervals. Last year, these three statistical articles were among the most popular:
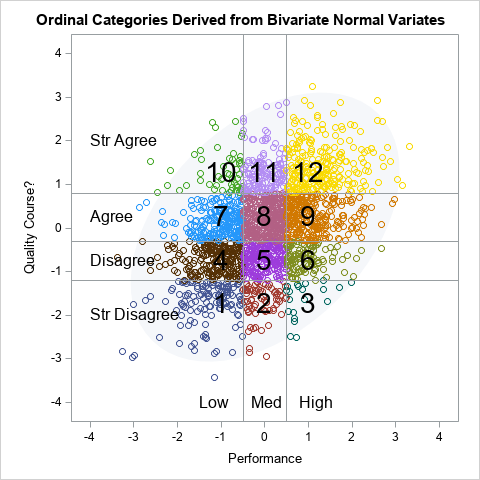
- What is polychoric correlation?: Polychoric correlation assumes that an ordinal response is a discretization of an underlying continuous variable. It's easy enough to estimate the polychoric correlation in SAS, but this article explains how to interpret and visualize polychoric correlation.
- The likelihood ratio test for linear regression: The likelihood ratio (LR) test enables you to compare two related models and decide whether adding more parameters results in a better model. This article shows that the test has a simple geometric interpretation: the test compares the full log-likelihood to the restriction of the log-likelihood function to a lower dimensional subspace.
- Estimate a proportion and a confidence interval: New programmers face three challenges when they use a language such as SAS. What procedure do you use? How do you create the input data set? And how to you specify options to obtain additional information such as confidence intervals or hypothesis tests? This article answers these questions for the simple problem of estimating a binomial proportion by using PROC FREQ.
Summary
Did you make a New Year's resolution to learn something new this year? You can get started by reading these 10 popular articles from 2024!

1 Comment
Pingback: 12 blog posts from 2024 that deserve a second look - The DO Loop