Have you ever run a regression model in SAS but later realize that you forgot to specify an important option or run some statistical test? Or maybe you intended to generate a graph that visualizes the model, but you forgot? Years ago, your only option was to modify your program and rerun it. Current versions of SAS support a less painful alternative: you can use the STORE statement in many SAS/STAT procedures to save the model to an item store. You can then use the PLM procedure to perform many post-modeling analyses, including performing hypothesis tests, showing additional statistics, visualizing the model, and scoring the model on new data. This article shows four ways to use PROC PLM to obtain results from your regression model.
What is PROC PLM?
PROC PLM enables you to analyze a generalized linear model (or a generalized linear mixed model) long after you quit the SAS/STAT procedure that fits the model. PROC PLM was released with SAS 9.22 in 2010. This article emphasizes four features of PROC PLM:
- You can use the SCORE statement to score the model on new data.
- You can use the EFFECTPLOT statement to visualize the model.
- You can use the ESTIMATE, LSMEANS, SLICE, and TEST statements to estimate parameters and perform hypothesis tests.
- You can use the SHOW statement to display statistical tables such as parameter estimates and fit statistics.
For an introduction to PROC PLM, see "Introducing PROC PLM and Postfitting Analysis for Very General Linear Models" (Tobias and Cai, 2010). The documentation for the PLM procedure includes more information and examples.
To use PROC PLM you must first use the STORE statement in a regression procedure to create an item store that summarizes the model. The following procedures support the STORE statement: GEE, GENMOD, GLIMMIX, GLM, GLMSELECT, LIFEREG, LOGISTIC, MIXED, ORTHOREG, PHREG, PROBIT, SURVEYLOGISTIC, SURVEYPHREG, and SURVEYREG.
The example in this article uses PROC LOGISTIC to analyze data about pain management in elderly patients who have neuralgia. In the PROC LOGISTIC documentation, PROC LOGISTIC fits the model and performs all the post-fitting analyses and visualization. In the following program, PROC LOGIST fits the model and stores it to an item store named PainModel. In practice, you might want to store the model to a permanent libref (rather than WORK) so that you can access the model days or weeks later.
Data Neuralgia; input Treatment $ Sex $ Age Duration Pain $ @@; datalines; P F 68 1 No B M 74 16 No P F 67 30 No P M 66 26 Yes B F 67 28 No B F 77 16 No A F 71 12 No B F 72 50 No B F 76 9 Yes A M 71 17 Yes A F 63 27 No A F 69 18 Yes B F 66 12 No A M 62 42 No P F 64 1 Yes A F 64 17 No P M 74 4 No A F 72 25 No P M 70 1 Yes B M 66 19 No B M 59 29 No A F 64 30 No A M 70 28 No A M 69 1 No B F 78 1 No P M 83 1 Yes B F 69 42 No B M 75 30 Yes P M 77 29 Yes P F 79 20 Yes A M 70 12 No A F 69 12 No B F 65 14 No B M 70 1 No B M 67 23 No A M 76 25 Yes P M 78 12 Yes B M 77 1 Yes B F 69 24 No P M 66 4 Yes P F 65 29 No P M 60 26 Yes A M 78 15 Yes B M 75 21 Yes A F 67 11 No P F 72 27 No P F 70 13 Yes A M 75 6 Yes B F 65 7 No P F 68 27 Yes P M 68 11 Yes P M 67 17 Yes B M 70 22 No A M 65 15 No P F 67 1 Yes A M 67 10 No P F 72 11 Yes A F 74 1 No B M 80 21 Yes A F 69 3 No ; title 'Logistic Model on Neuralgia'; proc logistic data=Neuralgia; class Sex Treatment; model Pain(Event='Yes')= Sex Age Duration Treatment; store PainModel / label='Neuralgia Study'; /* or use mylib.PaimModel for permanent storage */ run; |
The LOGISTIC procedure models the presence of pain based on a patient's medication (Drug A, Drug B, or placebo), gender, age, and duration of pain. After you fit the model and store it, you can use PROC PLM to perform all sorts of additional analyses, as shown in the subsequent sections.
Use PROC PLM to score new data
An important application of regression models is to predict the response variable for new data. The following DATA step defines three new patients. The first two are females who are taking Drug B. The third is a male who is taking Drug A. The call to PROC PLM scores those three patients according to the stored model. Notice the use of the ILINK option, which ensures that the score statement produces predicted probabilities. If you omit the ILINK option, you will obtain the logit (log odds) of the probabilities, which might not be what you want.
/* 1.Use PLM to score future obs */ data NewPatients; input Treatment $ Sex $ Age Duration; datalines; B F 63 5 B F 79 16 A M 74 12 ; proc plm restore=PainModel; score data=NewPatients out=NewScore predicted LCLM UCLM / ilink; /* ILINK gives probabilities */ run; proc print data=NewScore; run; |
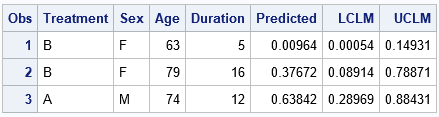
The output shows the predicted pain level for the three patients. The younger woman is predicted to have a low probability (0.01) of pain. The model predicts a moderate probability of pain (0.38) for the older woman. The model predicts a 64% chance that the man will experience pain.
Notice that the PROC PLM statement does not use the original data. In fact, the procedure does not support a DATA= option but instead uses the RESTORE= option to read the item store. The PLM procedure cannot create plots or perform calculations that require the data because the data are not part of the item store.
Use PROC PLM to visualize the model
I've previously written about how to use the EFFECTPLOT statement to visualize regression models. The EFFECTPLOT statement has many options. However, because PROC PLM does not have access to the original data, the EFFECTPLOT statement in PROC PLM cannot add observations to the graphs.
Although the EFFECTPLOT statement is supported natively in the LOGISTIC and GENMOD procedure, it is not directly supported in other procedures such as GLM, MIXED, GLIMMIX, PHREG, or the SURVEY procedures. Nevertheless, because these procedures support the STORE statement, you can use the EFFECTPLOT statement in PROC PLM to visualize the models for these procedures. The following statement uses the EFFECTPLOT statement to visualize the probability of pain for female and male patients that are taking each drug treatment:
/* 2. Use PROC PLM to create an effect plot */ proc plm restore=PainModel; effectplot slicefit(x=Age sliceby=Treatment plotby=Sex); run; |
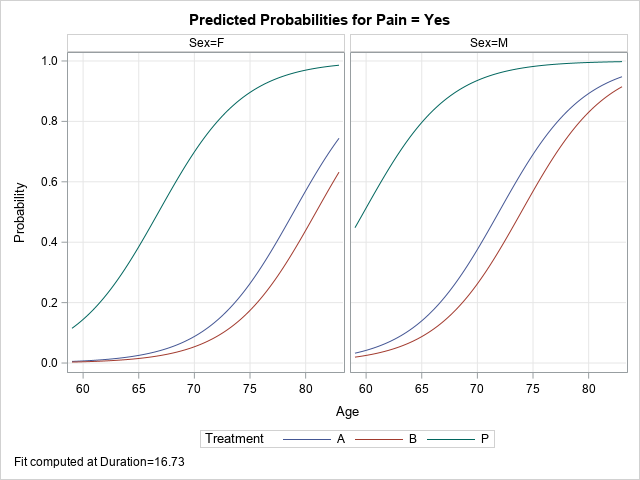
The graphs summarize the model. For both men and women, the probability of pain increases with age. At a given age, the probability of pain is lower for the non-placebo treatments, and the probability is slightly lower for the patients who use Drug B as compared to Drug A. These plots are shown at the mean value of the Duration variable.
Use PROC PLM to compute contrasts and other estimates
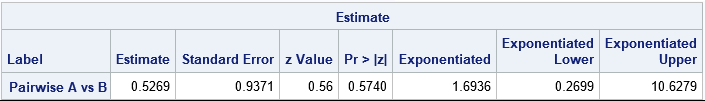
One of the main purposes of PROC PLM Is to perform postfit estimates and hypothesis tests. The simplest is a pairwise comparison that estimates the difference between two levels of a classification variable. For example, in the previous graph the probability curves for the Drug A and Drug B patients are close to each other. Is there a significant difference between the two effects? The following ESTIMATE statement estimates the (B vs A) effect. The EXP option exponentiates the estimate so that you can interpret the 'Exponentiated' column as the odds ratio between the drug treatments. The CL option adds confidence limits for the estimate of the odds ratio. The odds ratio contains 1, so you cannot conclude that Drug B is significantly more effective that Drug A at reducing pain.
/* 3. Use PROC PLM to create contrasts and estimates */ proc plm restore=PainModel; /* 'Exponentiated' column is odds ratio between treatments */ estimate 'Pairwise A vs B' Treatment 1 -1 / exp CL; run; |
Use PROC PLM to display statistics from the analysis
One of the more useful features of PROC PLM is that you can use the SHOW statement to display tables of statistics from the original analysis. If you want to see the ParameterEstimates table again, you can do that (SHOW PARAMETERS). You can even display statistics that you did not compute originally, such as an estimate of the covariance of the parameters (SHOW COVB). Lastly, if you have the item store but have forgotten what program you used to generate the model, you can display the program (SHOW PROGRAM). The following statements demonstrate the SHOW statement. The results are not shown.
/* 4. Use PROC PLM to show statistics or the original program */ proc plm restore=PainModel; show Parameters COVB Program; run; |
Summary
In summary, the STORE statement in many SAS/STAT procedures enables you to store various regression models into an item store. You can use PROC PLM to perform additional postfit analyses on the model, including scoring new data, visualizing the model, hypothesis testing, and (re)displaying additional statistics. This technique is especially useful for long-running models, but it is also useful for confidential data because the data are not needed for the postfit analyses.

13 Comments
Hi Rick.
Great post. Do you know how proc PLM works when you uss effect statement such as splines, can you score a new subject?
Thanks
Hocine
Yes, you can use the SCORE statement in PROC PLM to score new subjects even if the model contains complex effects like splines. There is an example in my article about how to compute derivatives for nonparametric regression models.
Hi Rick,
Thanks very much for posting this, I am currently running a logit model, and in the model I have some interaction terms, if I use the store statement in proc logistic and use proc plm to predict the probability of outcome in a new dataset, in this new dataset, do I need to construct the same interaction terms?
Thanks!
The scoring data set should contain the same VARIABLES as the input data set, but you do not need to create the interaction terms. For example, if your model statement is
MODEL Y = A B X1 A*X B*X;
then you only need to have the variables A, B, and X in the scoring data set.
Pingback: Predicted values in generalized linear models: The ILINK option in SAS - The DO Loop
Thank you so much. It is very good that it provides graphs as well.
Dear Rick - Such a great post on the use of proc plm. Does proc plm allow for computation of predicted values (Y^) based on specific values of the independent variables? So for example, Y=f(X1,X2), predict Y based on parameter estimates (b1,b2) and X1=2 and X2=4. Thanks! Marina
Yes. In statistics, that is called "scoring" the model at x1=2 and x2=4. See the section "Use PROC PLM to score new data" in this article.
Great, thank you so much!
Hello Rick,
I used a Mixed model for a linear regression. Because I can't find a way to test if the slope is equal to 1, I want to use PLM.
Can PLM test if a slope from a Mixed model is different from 1?
Both PROC MIXED and PLM support the usual SAS statements for hypothesis tests of fixed effects (such as ESTIMATE, LSMEANS, etc). So you can use either procedure.
Will PLM ever be able to work with random effects for scoring, estimates and for plots?
I do not what capabilities PROC PLM might support in the future. I have written about how to produce graphs that incorporate random effects into the predicted values. If that article does not address your question, then consider posting your data and question to the SAS Support Communities.