Editor's note: This blog post is part of a series of posts, originally published here by our partner News Literacy Project, exploring the role of data in understanding our world. Every day people use data to better understand the world. This helps them make decisions and measure impacts. But how do we take raw
Uncategorized
Let’s flash back to a simpler year. I don’t want to date myself, so think circa 1990s. I remember sitting with my now husband watching Ken Burns’ documentary Baseball when I was first introduced to Doris Kearns Goodwin. She didn’t just know baseball – it was part of her DNA. She was smart, funny and a storyteller. I became a fan that day, and only came
The changes we have seen during 2020 have prompted a lot of soul-searching. Around the globe and across industry sectors, companies are looking at ways they can improve how they do business. My conversations with clients suggest manufacturing companies recognize we have reached a tipping point. Adopting analytics and using
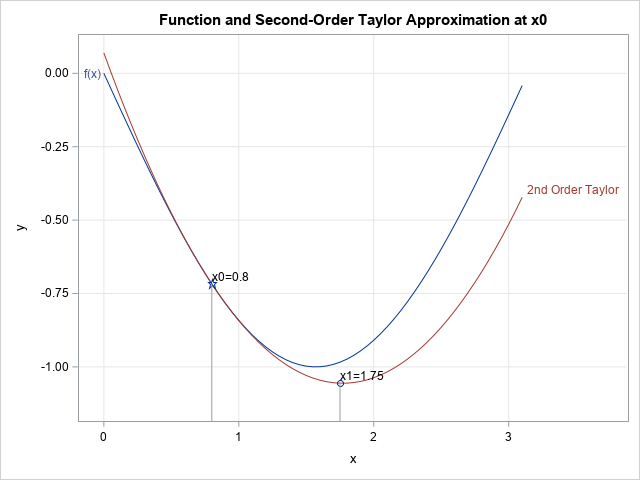
A segmented regression model is a piecewise regression model that has two or more sub-models, each defined on a separate domain for the explanatory variables. For simplicity, assume the model has one continuous explanatory variable, X. The simplest segmented regression model assumes that the response is modeled by one parametric
지난 텍스트 분석 시리즈 2편에서는 보험사의 데이터를 이용하여 예측 모델을 개발하고, 모델의 성능을 개선하여 고객 행동에 대한 예측도를 높이는 방법을 살펴봤습니다. 이번에는 영화 리뷰 데이터를 사용하여 분류 규칙을 개발하는 과정을 SAS Visual Text Analytics를 중심으로 알아보겠습니다. SAS Visual Text Analytics(이하, VTA)는 대용량의 비정형 데이터로부터 쉽게 인사이트를 추출할 수 있도록 설계된
We seem to be in the height of webinar season, so please add one more to your calendar, brought to you by SAS, CT Global Solutions, and the International Institute of Forecasters: I'll be delivering a short introduction, covering the disappointing state of real life business forecasting in contrast to
Banks don’t like to publicise it, but there’s already a place on most high streets that offers everyday banking services: the Post Office.
This resource is designed primarily for beginner to intermediate data scientists or analysts who are interested in identifying and applying machine learning algorithms to address the problems of their interest. A typical question asked by a beginner, when facing a wide variety of machine learning algorithms, is “which algorithm should
지난 텍스트 분석 시리즈 1편에서는 텍스트 토픽을 분류하여 빠르게 인사이트를 확보하는 방법을 소개해드렸습니다. 이번에는 텍스트 데이터를 기반으로 고객의 행동을 예측하고, 예측 모델링의 성능을 개선하는 방법을 알아보겠습니다. 이 작업에는 SAS의 머신러닝 솔루션인 SAS Visual Data Mining & Machine Learning(VDMML)이 유용합니다. 지금 이 시간에도 수많은 데이터 분석가들은 모델이 높은 성능을 발휘하도록 다양한
One purpose of principal component analysis (PCA) is to reduce the number of important variables in a data analysis. Thus, PCA is known as a dimension-reduction algorithm. I have written about four simple rules for deciding how many principal components (PCs) to keep. There are other methods for deciding how
Companies have been talking about disruption for years. The word appears in every other top-level business meeting – yet the revolution hasn’t happened. Many businesses have little to show for it. In truth, disruption needs more than enthusiasm. Without a strategy, organisations have simply transformed long, complicated paper processes into
November 26th and 27th most of us had time off. How was that time for you? I hope it was good - within pandemic-adjusted terms. If it felt in anyway less satisfying, fulfilling, relaxing...or it just felt...different...here are some things to consider. We are in a pandemic. This cannot be
COVID-19 has upset nearly every prediction and business plan for 2020 across the planet. Making predictions for 2021 may seem like a fool’s errand at this point, but many trends and consequences are already obvious and emerging from the global pandemic. The last global pandemic of this magnitude, the Spanish
"O Christmas tree, O Christmas tree, how lovely are your branches!" The idealized image of a Christmas tree is a perfectly straight conical tree with lush branches and no bare spots. Although this ideal exists only on Christmas cards, forest researchers are always trying to develop trees that approach the
All analytics projects have data as their foundation and this data is usually spread across a variety of databases, storage systems and locations. This diverse and complex landscape causes data scientists to spend an inordinate amount of time searching for the right data and preparing this information for analytics. It’s
Data, IA et transformation numérique pour l'Industrie du Futur. Fini de jouer ! Sans une approche industrielle c'est "No future" ! Les diamants sont éternels… KHEPRI, divinité mythologique de l’Égypte ancienne symbolisant la renaissance matinale du soleil, aurait inspiré le logo d’une marque automobile centenaire, véhicule de fonction culte d’un célèbre agent
Often, when a cybersecurity incident occurs, the clues to how it happened and who caused it are hidden in network data. In the example discussed here, data scientists were asked to identify who caused a global internet outage by examining a large graph of network data with data visualization. This
비정형 텍스트 데이터는 인류가 생성하는 가장 큰 데이터입니다. 더 나은 비즈니스 결정을 내리고, 제품 전략을 알리고, 고객 경험 개선에 도움이 되는 유용한 정보가 바로 이 데이터에 포함되어 있습니다. 비정형 텍스트 데이터의 잠재력을 최대한 활용해야 하는 이유입니다. 본 시리즈에서는 텍스트 데이터에서 인사이트를 얻는 주요 방법과 이를 위한 SAS 솔루션을 살펴봅니다. 전
We've turned some of our most notable predictions for next year into a slide show. Click the orange "next" button to see these 2021 predictions from SAS. Who’s brave enough to make predictions for next year after the unpredictable year we just had? We are. After all, the disruptive
Some people hear the words computer science and only think of coding but ask any computer scientist and they would tell you that coding is just a tool to solve important and interesting problems. At its core, computer science is about using technology to solve complex problems in the world,
A SAS customer asked a great question: "I have parameter estimates for a logistic regression model that I computed by using multiple imputations. How do I use these parameter estimates to score new observations and to visualize the model? PROC LOGISTIC can do the computation I want, but how do
Editor's note: This blog post is part of a series of posts, originally published here by our partner News Literacy Project, exploring the role of data in understanding our world. As discussed in previous posts, statistics and visual representations of data can be misleading. But what happens when the data itself is misleading? And if data is
A note from Udo Sglavo: A wealth of connectivity is pervasive in the data we gather across many industries. In other words, networks are all around us. A data science trend you cannot ignore is to organize, learn from, and drive decision-making based on connected data. Network analytics engines provide efficient
I believe the most important part of the analytics lifecycle is defining the business question being asked.
Most games of skill are transitive. If Player A wins against Player B and Player B wins against Player C, then you expect Player A to win against Player C, should they play. Because of this, you can rank the players: A > B > C Interestingly, not all games
On Friday Nov 27, 2:00pm GMT (9:00am EST in the US), Robert Fildes is presenting his latest research in the webinar "What do we need to know about Forecast Value Added?" This is part of the Lancaster University Centre for Marketing Analytics and Forecasting's "CMAF Friday Forecasting Talks." Here is
In football, five out of the 11 players on offense are on the field to accomplish one goal: keep the defenders as far away from the ball as possible. Sometimes it’s more than five. Teams will bring extra linemen on short-play packages. Tight ends and full backs might check in
What comes to mind when you think of a “homeless person”? Chances are, you’ll picture an adult, probably male, dirty, likely with some health conditions, including a mental illness. Few of us would immediately recall homeless individuals as family members, neighbors, co-workers and other loved ones. Fewer still are likely aware of how many youths (both minors and young adults) experience homelessness annually. Homeless youth is a population who can
It’s no surprise that nonprofit organizations providing health-related services are overconsumed during the COVID-19 pandemic, but what about other types of nonprofits? According to CNM President and CEO, Tina Weinfurther, the pandemic has affected nonprofits in different ways. Some are running on fumes, while others have doubled in size and
I previously showed how to create a decile calibration plot for a logistic regression model in SAS. A decile calibration plot (or "decile plot," for short) is used in some fields to visualize agreement between the data and a regression model. It can be used to diagnose an incorrectly specified