
A good public transportation system is crucial to develop smart cities, particularly in great metropolitan areas. It is essential in maintaining the flow of its residents' daily commutes and allows tourists to easily move around the city. Public transportation agencies around the globe openly share their data for application development and research. All this data can be used to explore the network topology and optimize elements within public transportation options. Network optimization algorithms can be applied to better understand urban mobility, particularly based on a multimodal public transportation network.
Various algorithms can be used to evaluate and understand a public transportation network. The Minimum Spanning Tree algorithm can reveal the most critical routes needed to maintain the same level of accessibility in the public transportation network. It basically specifies which stations (trains, metros, trams, and buses) need to be maintained for the reachability of the original network to stay the same; considering all other available stations. The Minimum-Cost Network Flow can describe an optimal way to flow the population throughout the city, allowing better plans for commuting based on available routes and their capacities, considering all possible types of transportation. The Path algorithm can reveal all possible routes between any pair of locations. This is particularly important in a network considering a multimodal transportation system. It gives transportation authorities a set of possible alternate routes in case of unexpected events. The Shortest Path can reveal an optimal route between any two locations in the city, allowing security agencies to establish faster emergency routes. The Transitive Closure algorithm identifies which pairs of locations are joined by some route, helping public transportation agencies to account for the reachability in the city.

Traveling Salesman Problem
The algorithm emphasized here is the Traveling Salesman Problem. Its solution requires finding the minimum-cost tour within a network. In my case, the minimum-cost is based on the distance traveled, considering a set of locations to visit, based on all possible types of transportations available in the network. More specifically, the cost is the walking distance, which means I will try to minimize the distance needed to walk to visit all the places on my tour list.
Open public transportation data allows both companies and individuals to create applications that can help residents, tourists, and even government agencies with planning and deploying public services efficiently. In this case, I am going to use open data provided by some transportation agencies in Paris (RAPT – Régie Autonome des Transports Parisiens – and SNCF – Société Nacionale des Chemins de fer Français).
The first step is to collect and evaluate the appropriate data and create a transportation network. The data contains information about 18 metro lines, 8 tram lines, and 2 major train lines. It comprises information about all lines, stations, timetables, coordinates, among many others. This data builds the transportation network, identifying all possible stops and step sequences performed when traveling the city through its public transportation system.
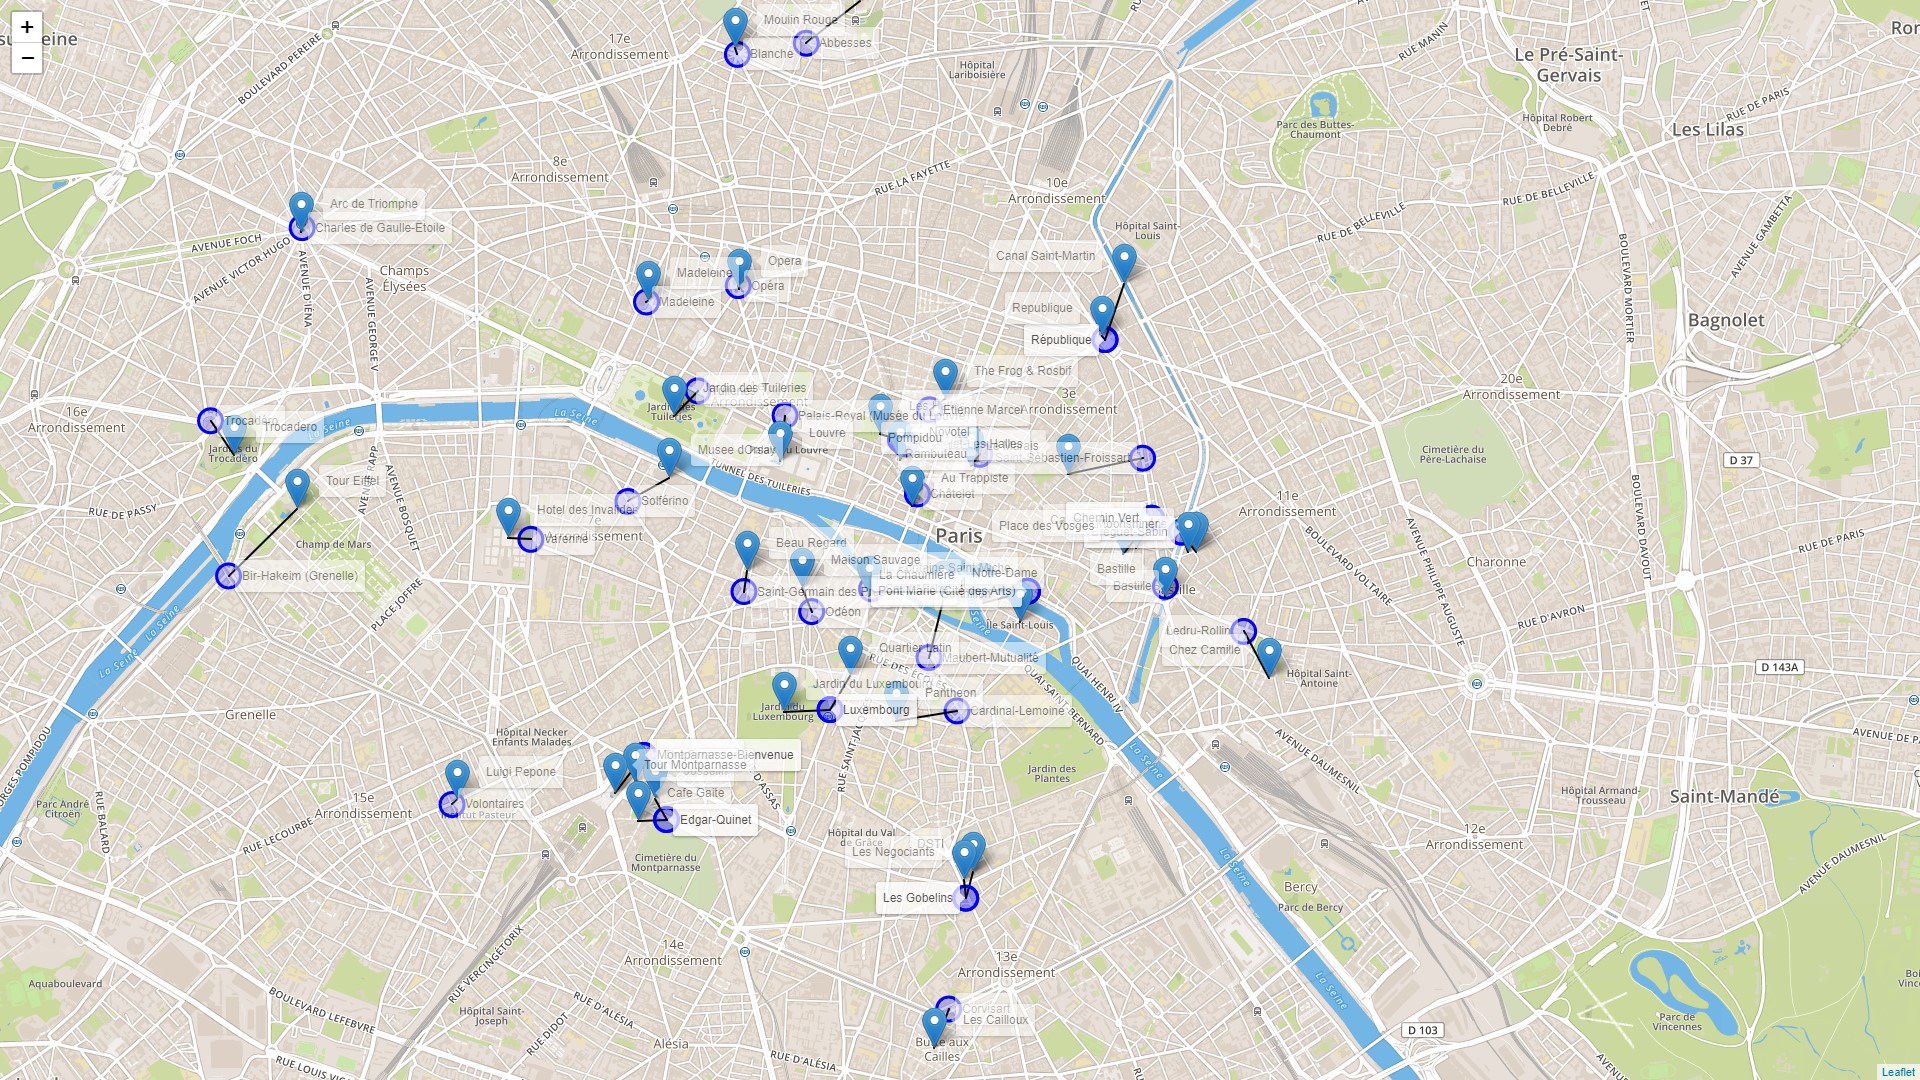
I want to particularly show the traveling salesman problem algorithm and to do that, I am going to visit Paris. I've selected a set of 42 places: a hotel in Les Halles (the starting and ending point) and 41 places of interest, including the most popular tourist locations in Paris, and my preferred cafés and restaurants. I would visit all the cafés and restaurants if I could! I am going to execute two optimal tours. The first tour will consist of just walking. Paris is a beautiful city and there's nothing better than just walking through the city of lights. The second tour considers the multimodal public transportation system. This tour doesn’t help me to enjoy the wonderful view as much, but it will definitely help me to enjoy the delicious cafés and restaurants for longer... Oh, and the tourist spots, too!
By the way, if you'd like to see this done on video, we've got you covered:
Without further ado, let’s get started. The first step is to set up the 42 places based on x and y coordinates.
data places; length name $20; infile datalines delimiter=","; input name $ x y; datalines; Novotel,48.860886,2.346407 Tour Eiffel,48.858093,2.294694 Louvre,48.860819,2.33614 Jardin des Tuileries,48.86336,2.327042 Trocadero,48.861157,2.289276 ... Luigi Pepone,48.841696,2.308398 Les Negociants,48.837129,2.351927 Au Trappiste,48.858295,2.347485 ; run; |
An HTML file is created to show all these places in a map. Leaflet is the open source map used here.
filename arq "&dm/parisplaces.htm"; data _null_; set places end=eof; file arq; length line $1024.; k+1; if k=1 then do; put '<!DOCTYPE html>'; put '<html>'; put '<head>'; put '<title>SAS Network Optimization</title>'; put '<meta charset="utf-8" />'; put '<meta name="viewport" content="width=device-width, initial-scale=1.0">'; put '<link rel="stylesheet" href="https://unpkg.com/leaflet@1.5.1/dist/leaflet.css" integrity="sha512-xwE/Az9zrjBIphAcBb3F6JVqxf46+CDLwfLMHloNu6KEQCAWi6HcDUbeOfBIptF7tcCzusKFjFw2yuvEpDL9wQ==" crossorigin=""/>'; put '<script src="https://unpkg.com/leaflet@1.5.1/dist/leaflet.js" integrity="sha512-GffPMF3RvMeYyc1LWMHtK8EbPv0iNZ8/oTtHPx9/cc2ILxQ+u905qIwdpULaqDkyBKgOaB57QTMg7ztg8Jm2Og==" crossorigin=""></script>'; put '<style>body{padding:0;margin:0;}html,body,#mapid{height:100%;width:100%;}</style>'; put '</head>'; put '<body>'; put '<div id="mapid"></div>'; put '<script>'; put 'var mymap=L.map("mapid").setView([48.856358, 2.351632],14);'; put 'L.tileLayer("https://api.tiles.mapbox.com/v4/{id}/{z}/{x}/{y}.png?access_token=pk.eyJ1IjoibWFwYm94IiwiYSI6ImNpejY4NXVycTA2emYycXBndHRqcmZ3N3gifQ.rJcFIG214AriISLbB6B5aw",{maxZoom:20,id:"mapbox.streets"}).addTo(mymap);'; end; line='L.marker(['||x||','||y||']).addTo(mymap).bindTooltip("'||name||'",{permanent:true,opacity:0.7}).openTooltip();'; if name = 'Novotel' then do; line='L.marker(['||x||','||y||']).addTo(mymap).bindTooltip("'||name||'",{permanent:true,opacity:1}).openTooltip();'; line='L.circle(['||x||','||y||'],{radius:75,color:"'||'blue'||'"}).addTo(mymap).bindTooltip("'||name||'",{permanent:true,opacity:1}).openTooltip();'; end; put line; if eof then do; put '</script>'; put '</body>'; put '</html>'; end; run; |
Here is the map with all the places I want to visit.
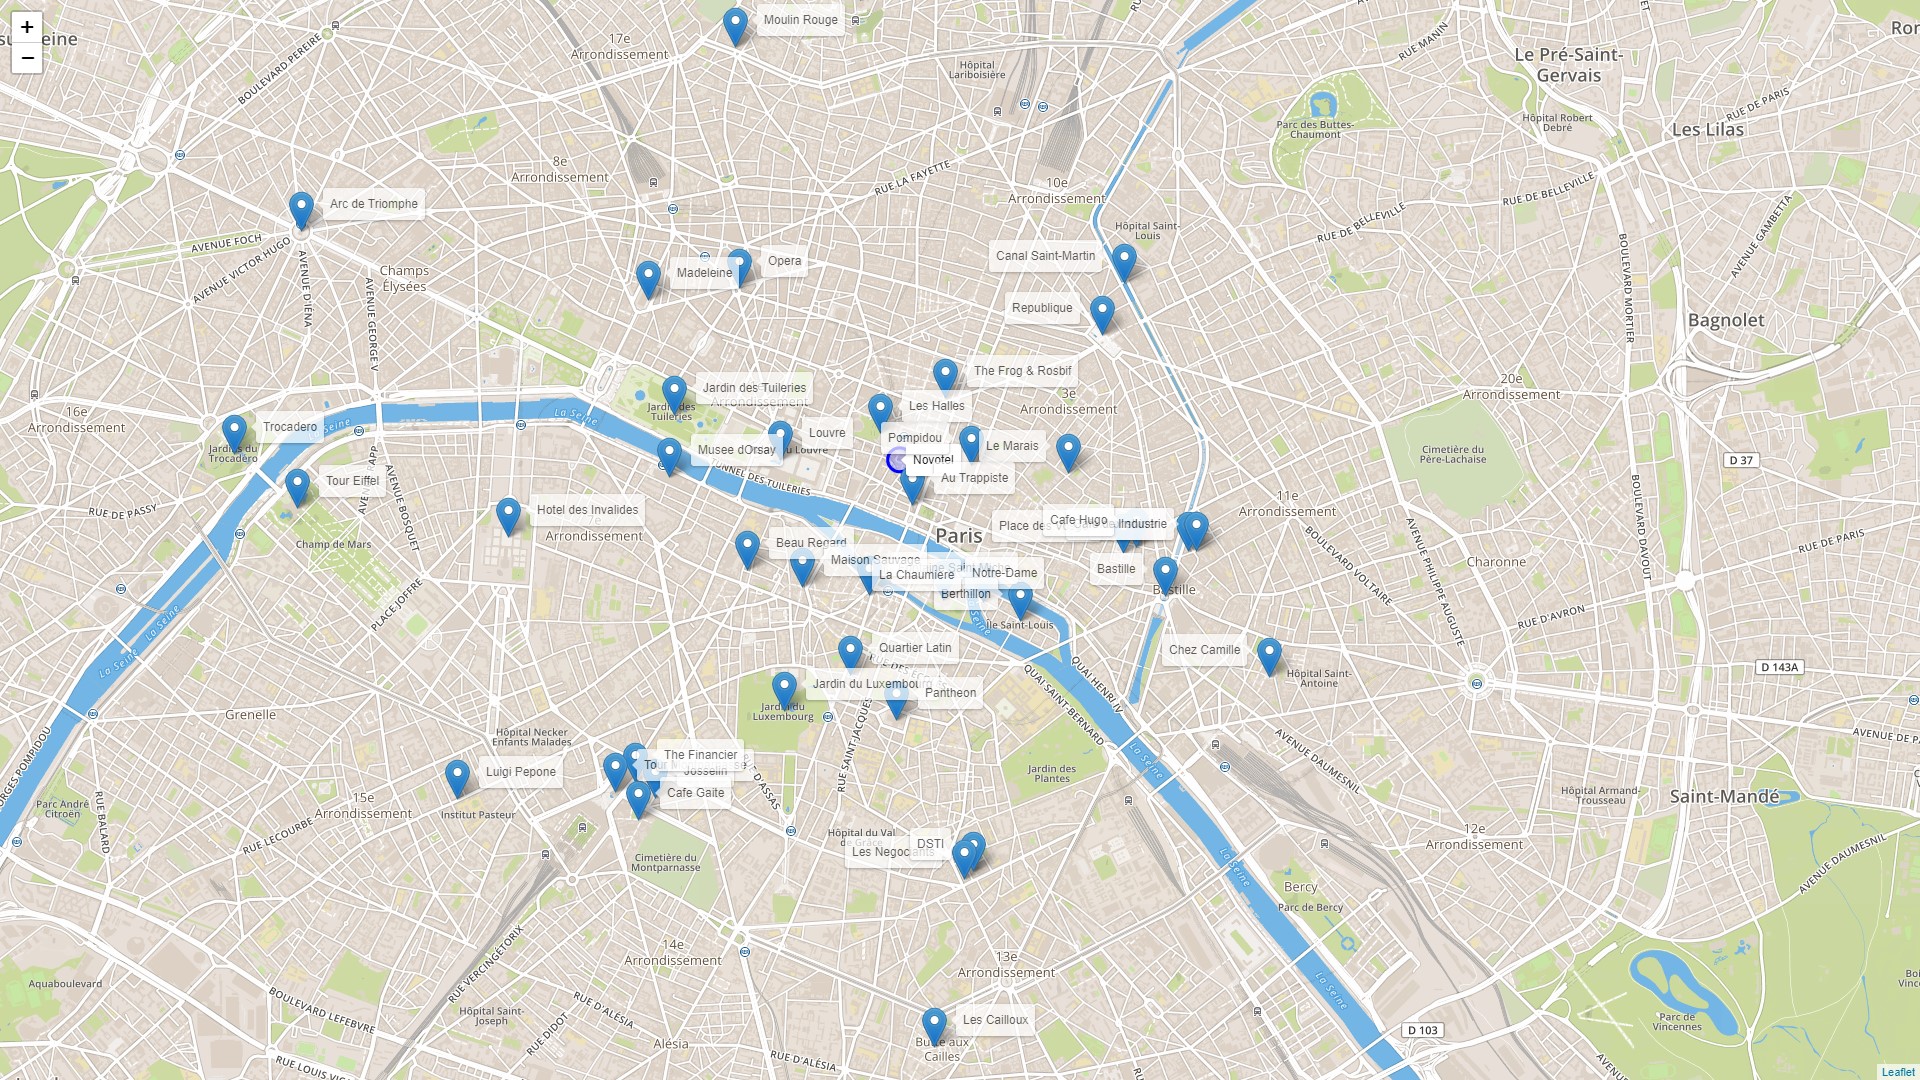
There are so many places to visit... so many cafés. I am not sure if I can make it to all of them. At least, I don't know if I can walk all this and still have working legs by the end. Plus, there are so many possible decisions to make through this tour. I would get lost easily. Combining all pairs of locations, I have 1,722 possible steps.
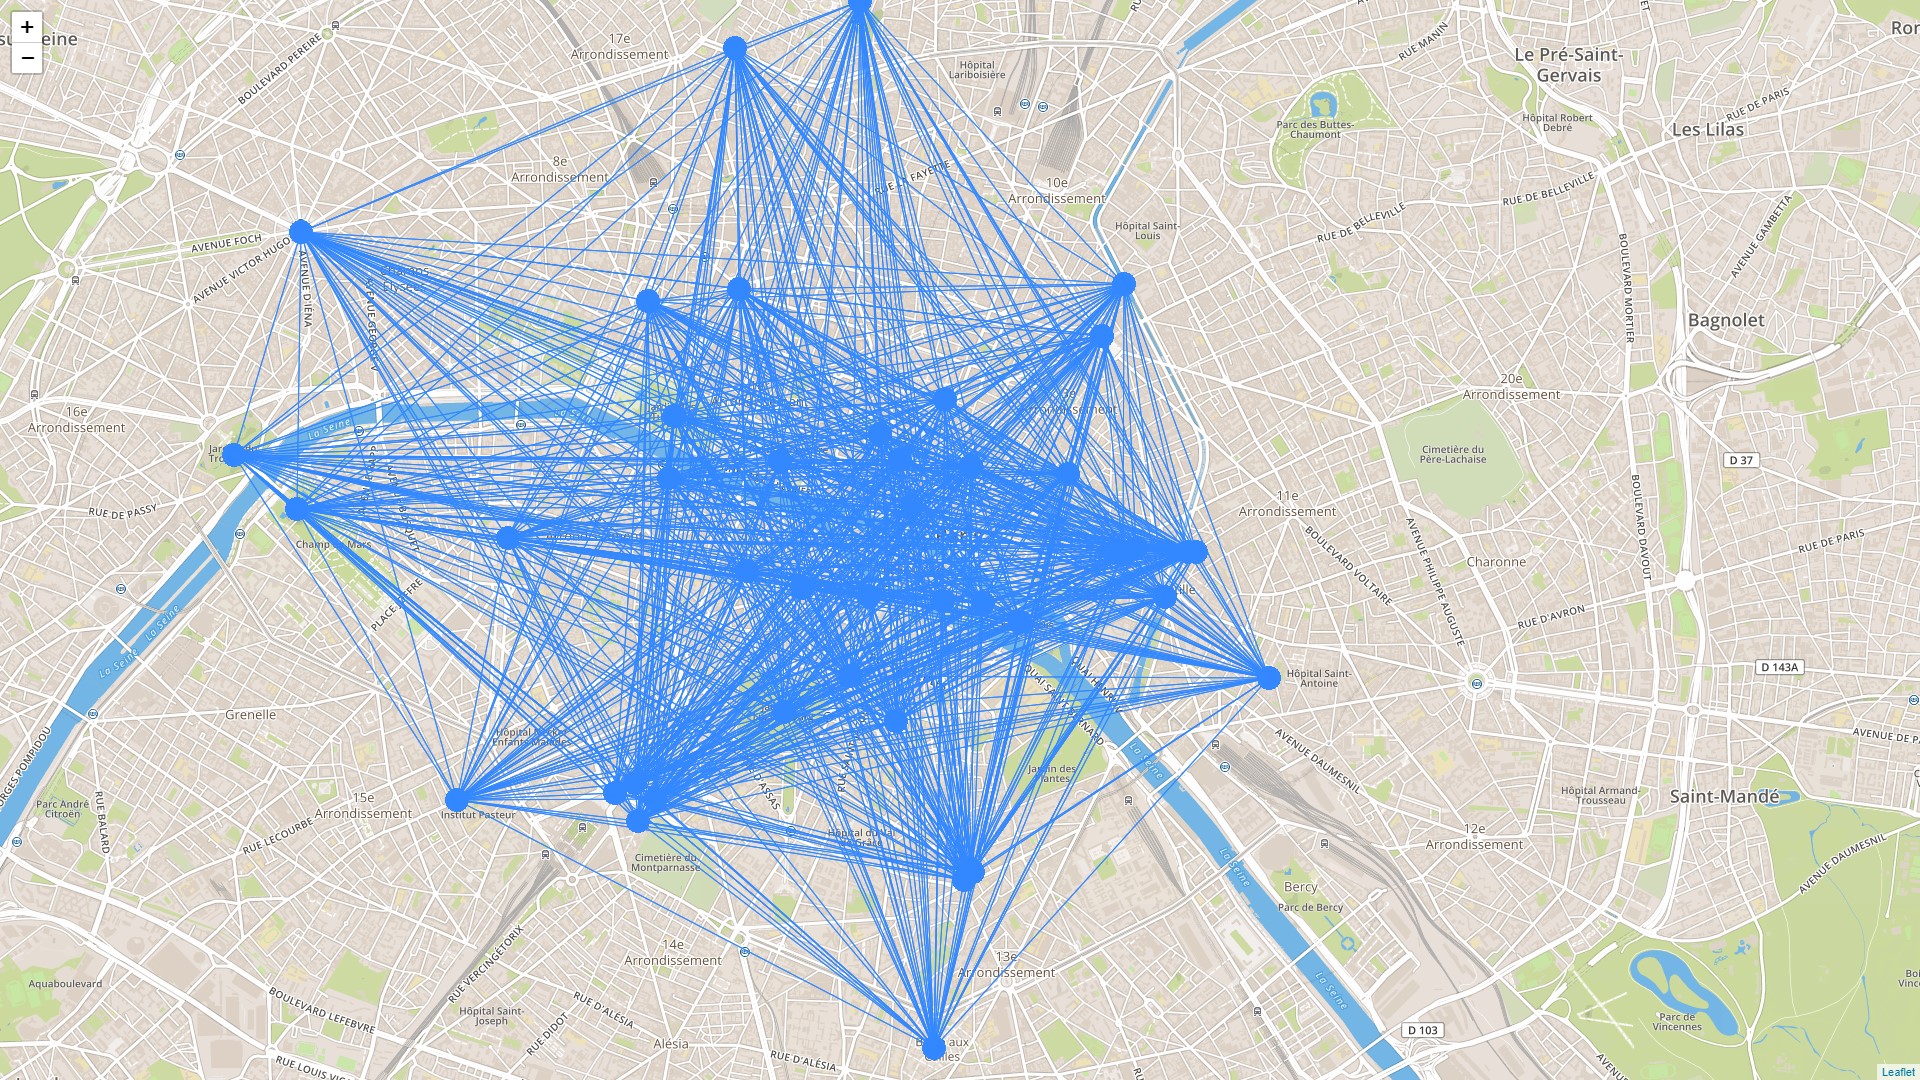
OK, this is too much, I definitely need help through proc network and proc optnetwork, the network analysis and optimization package for SAS Viya. The Traveling Salesman Problem (TSP) is one of the multiple network optimization algorithms included in this package. The TSP algorithm aims to find the minimum-cost tour in a graph. A path in a graph is a sequence of nodes linked to each other. An elementary cycle is a path where the start node and the end node are the same. A tour is essentially an elementary cycle where every node is visited just once (no matter how much you like the place!). TSP aims to find the tour with a minimum total cost. The cost here is the distance traveled.
I calculate the Euclidian distance for all possible links between all locations I want to visit so I can use the TSP algorithm to search for the optimal tour.
proc optnetwork direction = directed links = mycas.placesdist out_nodes = mycas.placesnodes; linksvar from = org to = dst weight = distance; tsp cutstrategy = none heuristics = none milp = true out = mycas.placesTSP; run; |
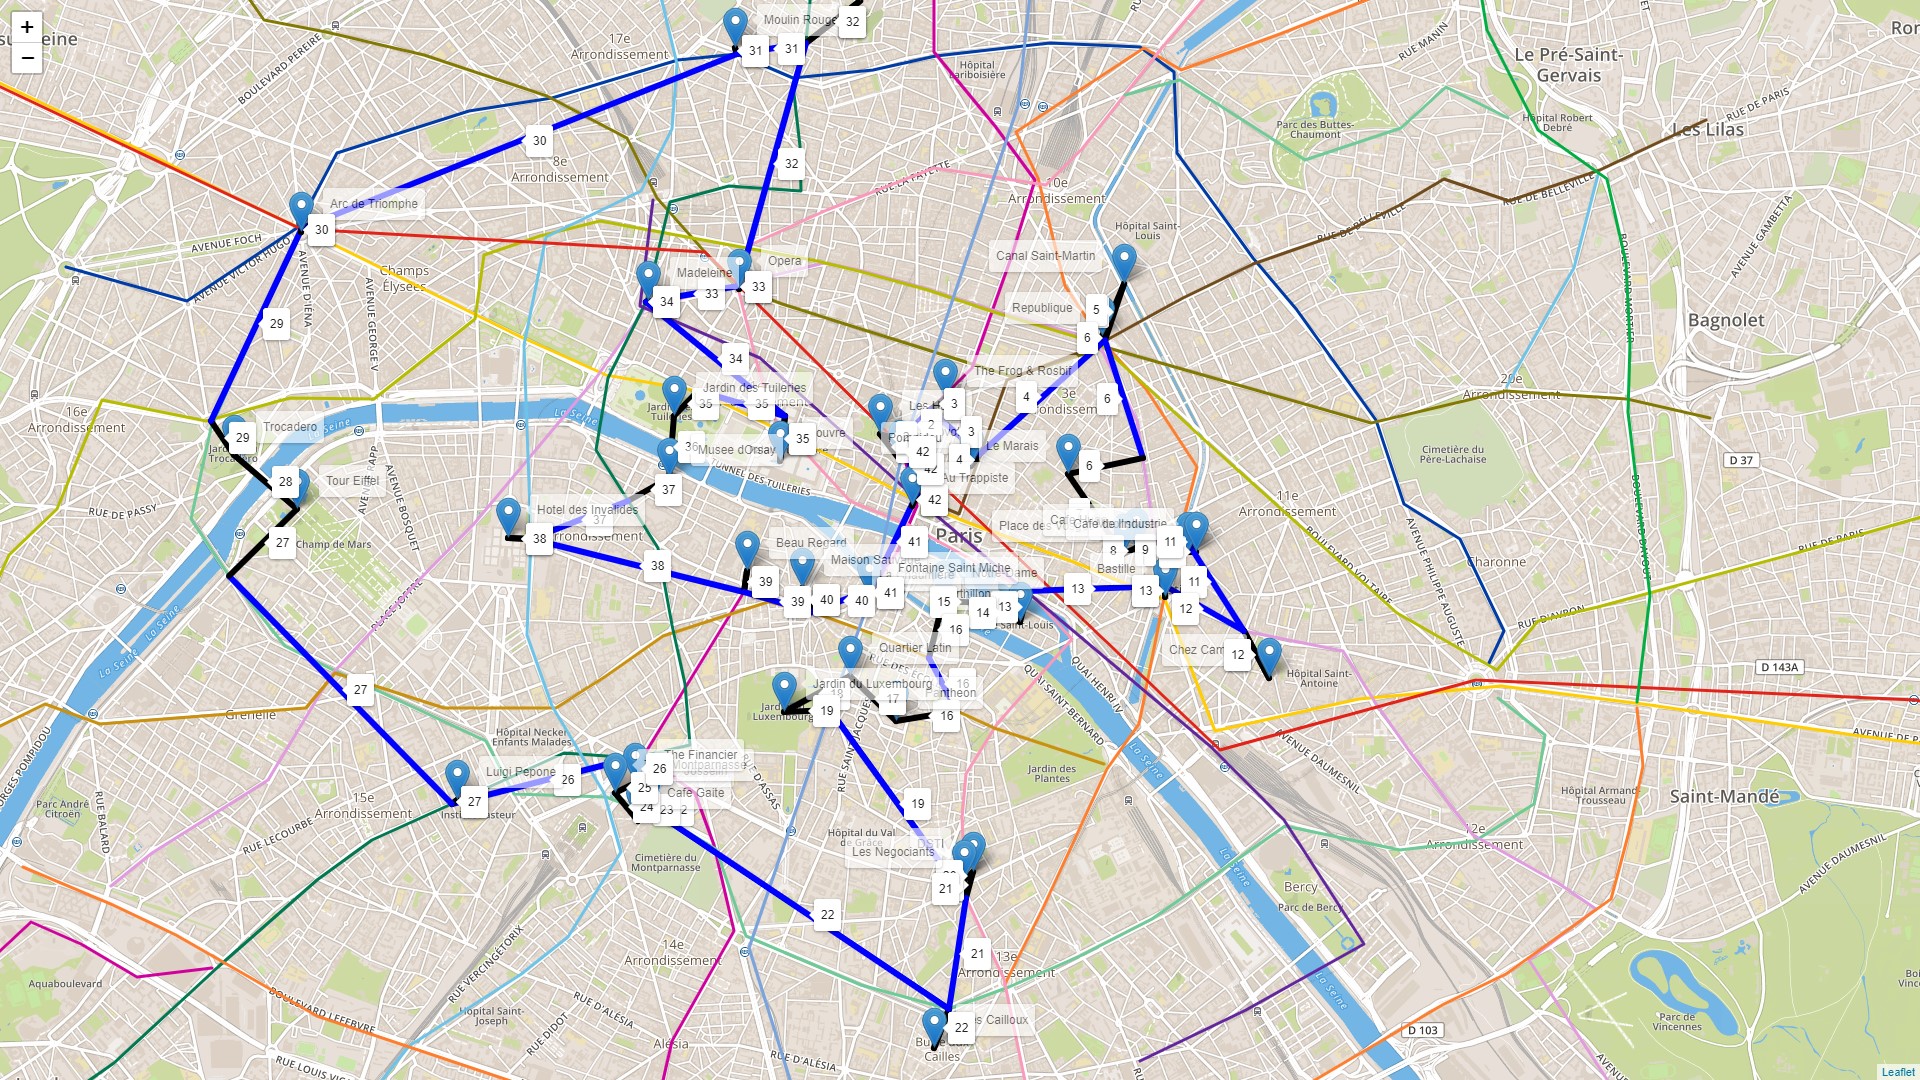
Here is my optimal tour on the map.
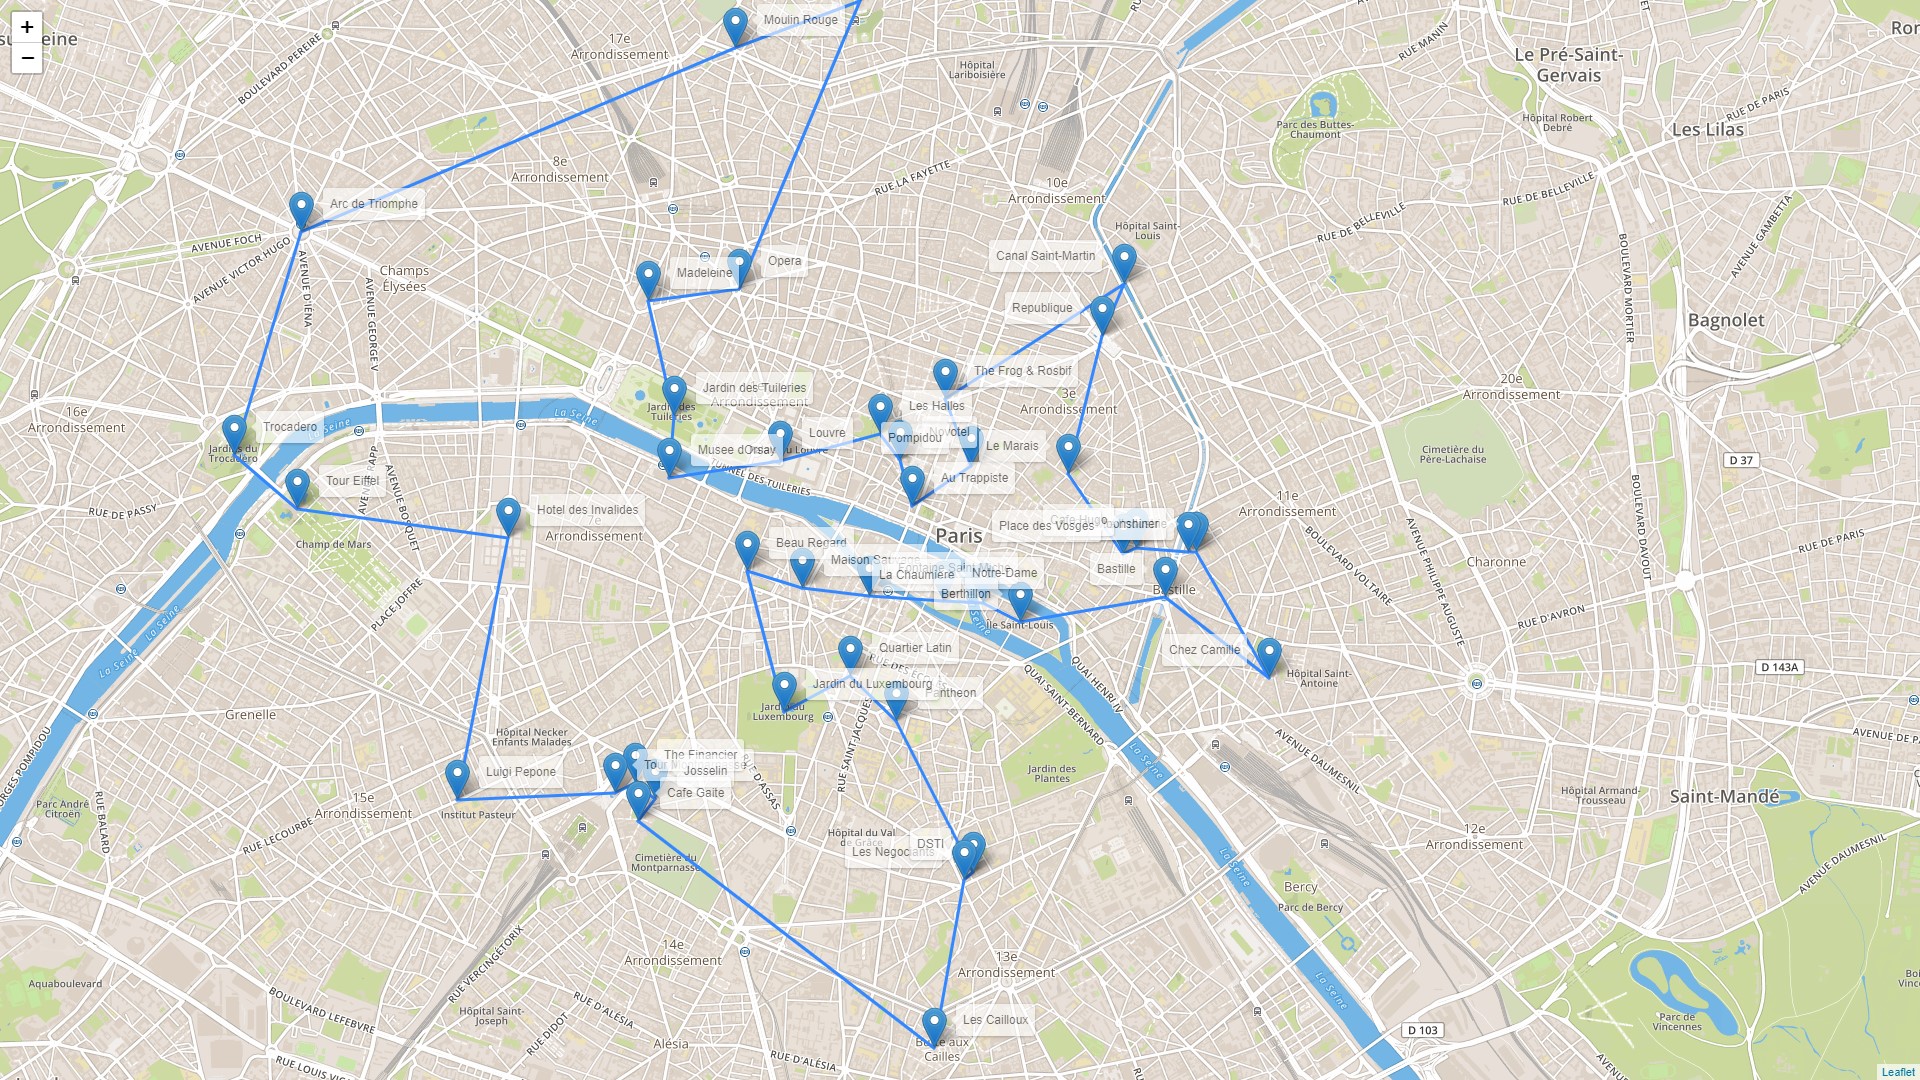
The best tour to visit all 41 locations requires 19.4 miles of walking. For me, this is almost a marathon. This walking tour would take me 6 hours and 12 minutes. It is too much!
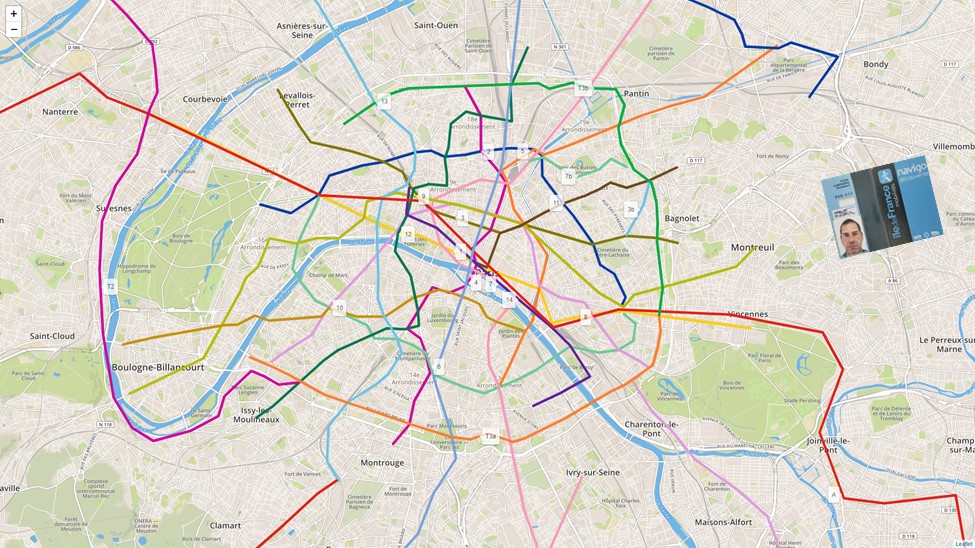
A feasible approach to reduce the walking distance is to use the public transportation system. In Paris, this network considers trains, trams and metro, and of course, buses (it doesn't count scooters, bicycles, motorcycles, electric cars, etc.). Our tour does not consider the bus network, just trains, trams, and metro. The open data provided by the RATP is used to create a public transportation network, considering 27 lines (16 metro lines, 9 tram lines out of existing 11 and 2 train lines out of existing 5) and 518 stations. Here I will take advantage of my Navigo card to travel as many times as I need.
Now I can enhance my optimal tour considering the multimodal transportation system, including not just walking, but also the public lines. An upgrade from my initial optimal tour is that through public transportation, the distance I need to walk from two points of interest and their respective closest stations should be less than the distance between those two points. Otherwise, I will just walk. For example, if the total distance of walking from the origin place A to the closest station to A plus from the closest station to B to the destination place B is greater than the distance just walking from A to B, there is no reason to take the public transportation. If that distance is less than the distance from A to B, then I will take the public transportation.
Then I need to calculate the closest station to each point of interest I will visit (which stations serve these places, and which is the closest). For each possible step in my best tour, I need to confirm if it is better to walk or to take public transportation.
Once I calculate the distances between all the places to visit and the places to the nearest stations, I can compare all possible steps in my path in terms of shortest distances to see if I will take public transportation or just walk. I will then execute the TSP algorithm again to search for the optimal tour considering both walking and public transportation.
Now I know my optimal sequence of places to visit to minimize my walking distance, and I know when to walk and when to take public transportation. The last step in this multimodal tour is to find the shortest path between any two stations in my optimal tour. Paris has a very dense public transportation network, which means that there are many options to go from one place to another considering not just multiple lines, but also multiple types of transportation like metro, train, or tram. I need to find the shortest one for each pair of stations considered in my tour. To do this, I need to run another algorithm, the Shortest Path.
The shortest path problem aims to find the path between two nodes in a graph where the sum of its links' weights is minimized. The weight of the link here is the distance. It finds the path between two nodes u and v in a graph with the lowest total link weight, considering all possible paths starting at u and ending at v.
proc optnetwork direction = undirected links = mycas.metrolinks; linksvar from = org to = dst weight = dist; shortestpath outpaths = mycas.shortpathmetrotour; run |
Now I know the best sequence of places to visit, when to walk and when to take public transportation, and what route should I go when I do take public transportation.
A tour can start and end at any place, but I want mine to be the same place. I need to make a minor adjustment to my results. I will start my tour at Novotel Les Halles and I want to (hopefully) finish at the same place at the end of the day. I simply duplicate the results and select the sequence that starts and ends at Novotel.
data stationplacestep; set mycas.stationplacetsp mycas.stationplacetsp; run; data stationplacestepstart; set stationplacestep; if plorg = 'Novotel' then k+1; if k = 1 then do; order+1; drop k; output; if pldst = 'Novotel' then K+1; end; run; |
Now I finally have my optimal multimodal tour.
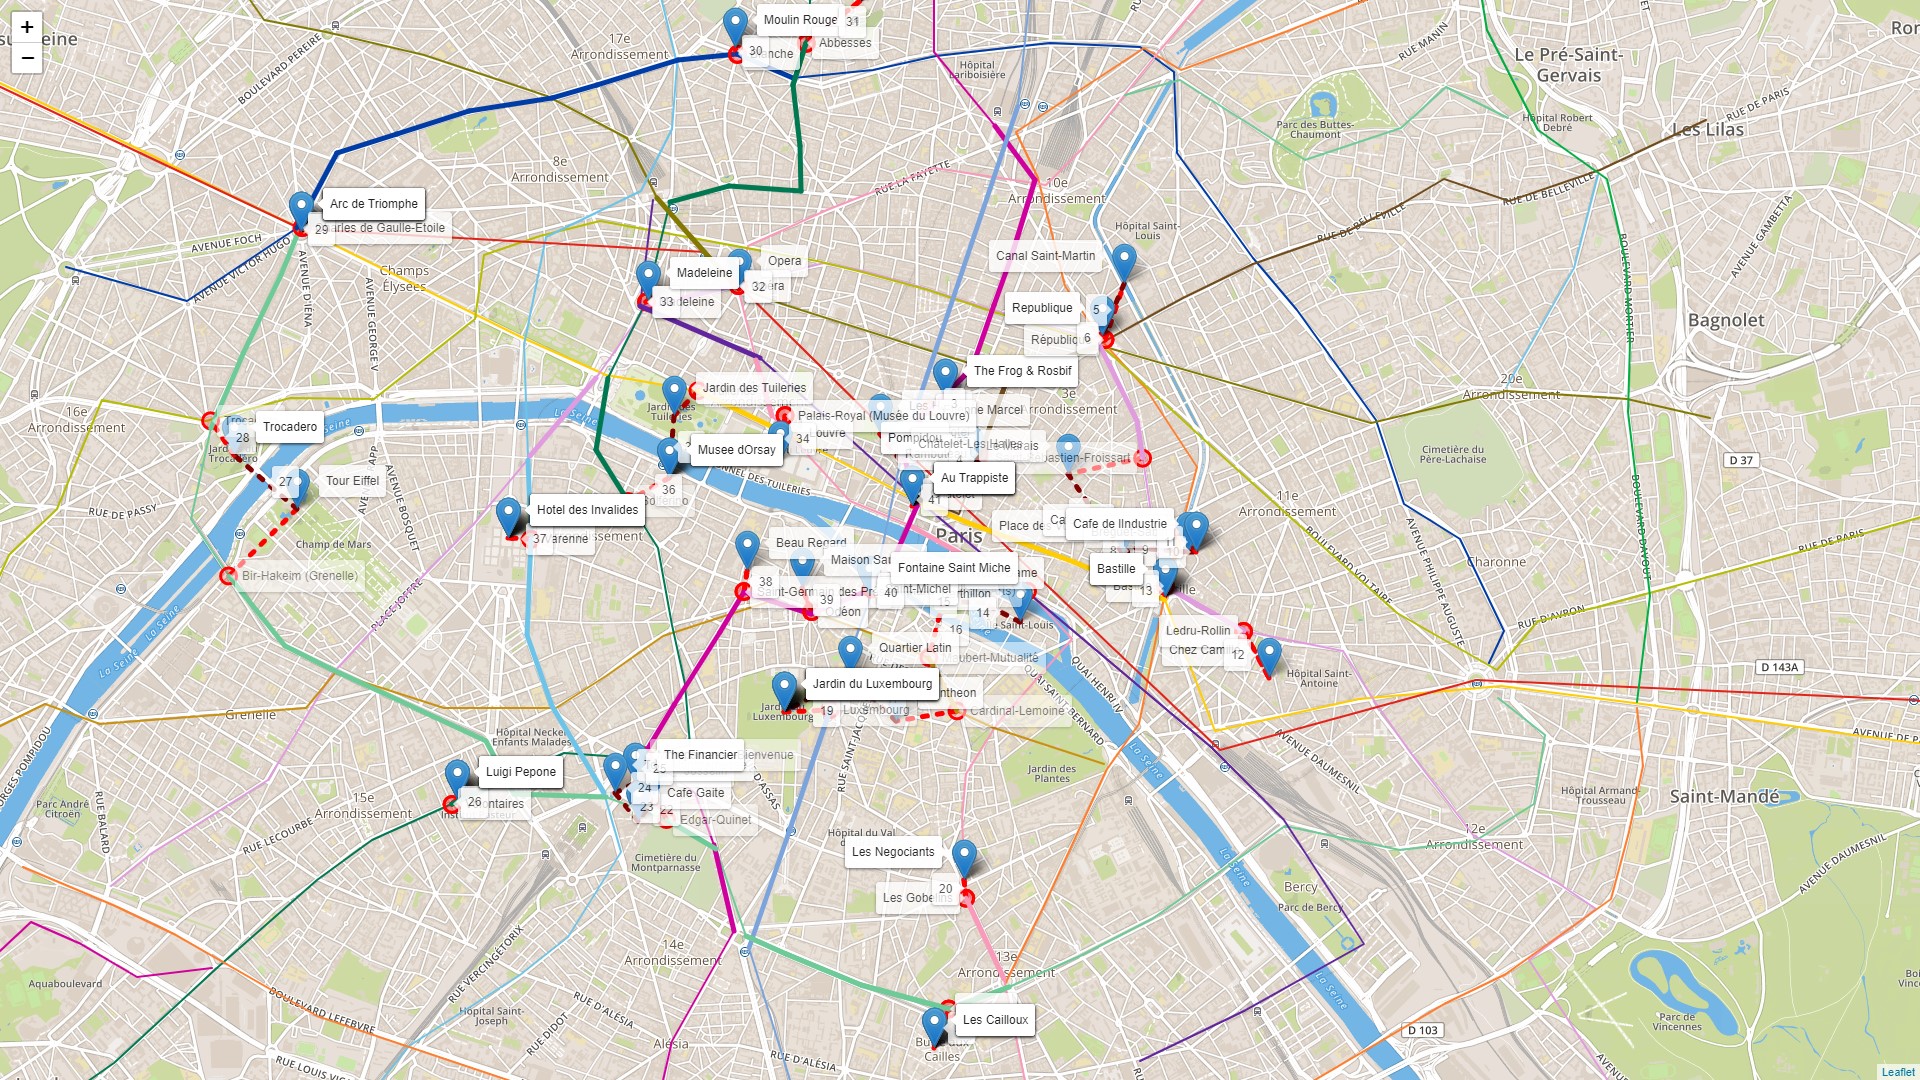
In step 21 of my tour, I stop by at Les Cailloux, an Italian restaurant in the Butte aux Cailles district, an art deco architectural heritage neighborhood. From there, I walk to the Covisart station and I take line 6 until Edgar Quinet. From there, I walk to Josselin and I grab a crepe (one of the best in the area). Then I walk to Café Gaité and enjoy a beer, just watching people walk by. The concept of a shot of coffee that lasts for hours at outside tables applies for a beer as well. It is a very nice area with lots of bars and restaurants. Then I walk to the Montparnasse Tower. Probably the best view of Paris, because from there you can see the Eiffel Tower. It beats out the Eiffel Tower because you can’t see the Eiffel Tower while you're on the Eiffel Tower! You don’t need to buy a ticket (18€) for the Observation Deck. Go to the restaurant Ciel de Paris on the 56th floor and enjoy a coffee or a glass of wine. You may be lower 1 or 2 floors but will save 13€ or 9€, depending on what you pick. From there, I walk to the Financier, an honest pub because you know I must stop by a pub. From there I walk to the Montparnasse station and I take line 6 again. I get off at the Pasteur station and switch to line 12. I get off at the Volontaires station and I walk to the Pizzeria Luigi Pepone (the best pizza in Paris – ask for Richard). And from there my tour continues. I am still on step 26 and I have 14 more steps to go. Now you understand why I need an optimization algorithm to search for the best tour. There are just too many places to visit!
If you recall (after so many bars and restaurants), the walking tour would take me 19.4 miles and 6 hours and 12 minutes of walking. Now, my multimodal tour will take me 27.6 miles (more than the first one) but I will walk just 2.8 miles and the entire tour will take just 2 hours and 30 minutes. Here is the new dilemma- since I'm stopping at so many restaurants and bars, I should walk more to burn off the calories. But by walking more around the city, I can't help myself from stopping at even more bars and restaurants. Perhaps there is another optimization algorithm that can help me solve this...
Merci for reading! To see optimal tours done in different cities, please check out these videos:


3 Comments
You paper is fascinating. I try to run your program, I guess, without SAS Viya. The part with:
links = mycas.placesdist
out_nodes = mycas.placesnodes;
causes an error because I don't have access to mycas, or, I guess gain, tools in Cloud.
Could you provide a helpful tip or two. Thank you.
Akira Kondo
Thanks Akira. I am sending you an email with further explanations.
Pingback: Vehicle Routing Problem - A beer distribution example in Asheville - The SAS Data Science Blog