If you've been stuck at home a lot lately, and think you have run out of movies to watch -- think again! Here is a list of big-budget movies you might not have seen, because they flopped (lost lots of money). Follow along as I show you how I created my interactive graphical list, or jump down to the bottom to see the finished list...
The Data
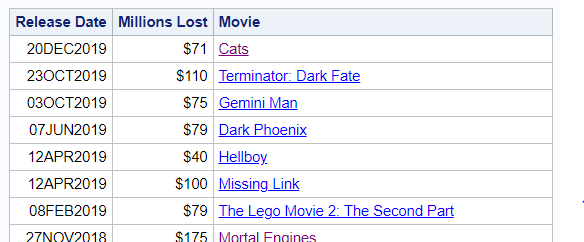
I saw this online list of 45 Of The Most Expensive Box Office Flops Ever Made. It was an interesting article, with details about why each of these movies failed and lost lots of money. But I had to do a lot of scrolling to see what all the movies were, and how many millions of $ they had lost. And I had no clue when many of the movies had been released. Therefore I decided to create my own graphical/interactive list, with just the pertinent information, and add the release dates (which I had to lookup on the web), and allows me to click each movie to find out more details.
Here's a sample of what my nice/summarized data looked like:
First Attempt
In my first attempt, I used a needle plot, where the length of the needle was the amount of $ each movie lost, and I plotted it along a time axis by the release date. I overlaid a text plot, so the name of each movie was shown at the end of the needle. And one little trick - I used the reverse option on the yaxis, so the needles were pointing down (I thought that seemed appropriate, since the values represented the amount of money lost).
It was an interesting graph, but since many of the movies were released around the same dates, many of the titles were overlapping (and therefore impossible to read).
proc sgplot data=my_data noautolegend noborder;
needle x=date y=loss_millions / lineattrs=(color=red) markers markerattrs=(color=red);
text x=date y=text_y text=title / position=right rotate=90 contributeoffsets=(ymin)
textattrs=(color=blue size=8pt);
yaxis display=(nolabel noticks noline) reverse grid gridattrs=(pattern=dot color=gray88);
xaxis display=(nolabel);
run;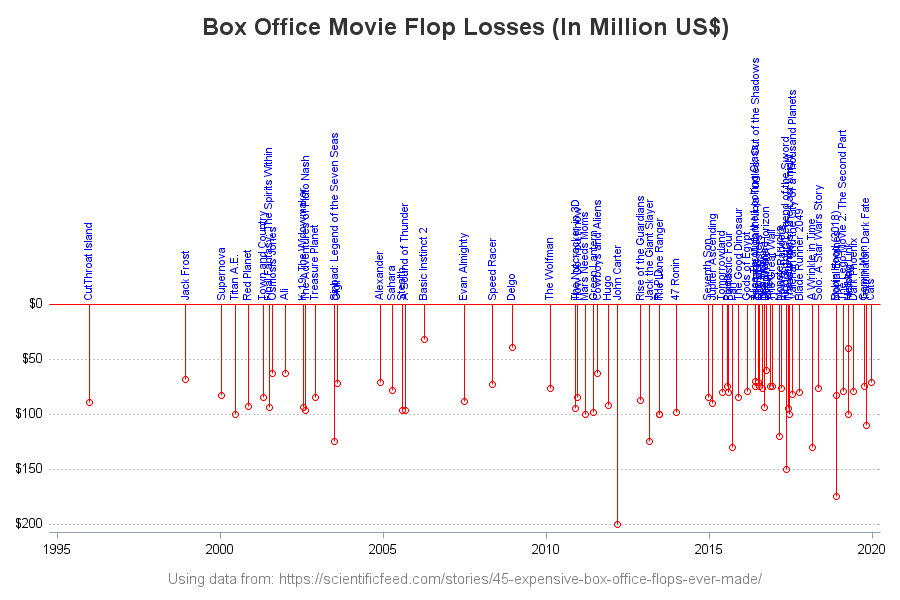
Refined Attempt
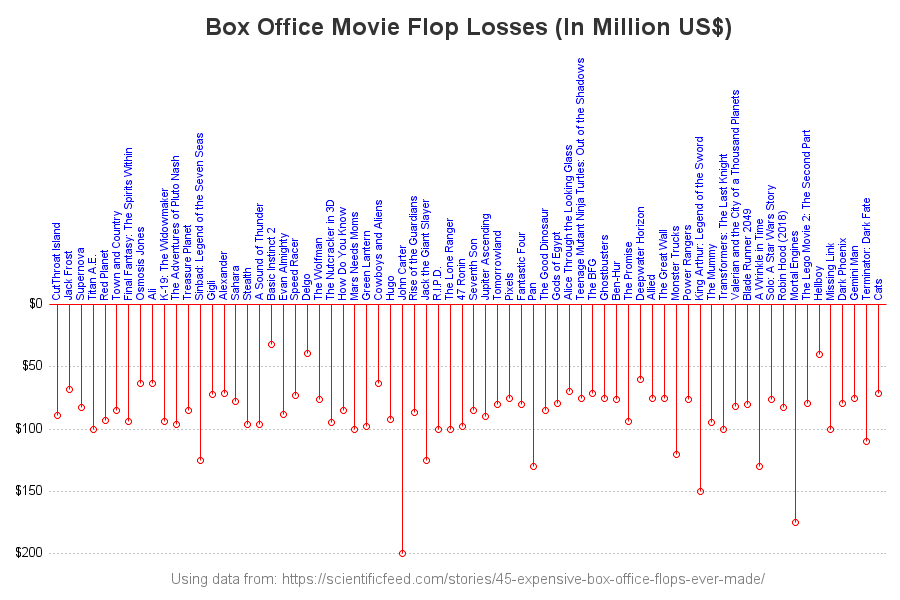
To avoid the overlapping text, I applied the discrete option so that each of the date values would be plotted as evenly-space discrete values along the xaxis. The movies are still arranged in the order they were released - just not proportionally spaced. But there's still a problem - can you see it in the graph below?...
proc sgplot data=my_data noautolegend noborder;
needle x=date y=loss_millions / lineattrs=(color=red) markers markerattrs=(color=red);
text x=date y=text_y text=title / position=right rotate=90 contributeoffsets=(ymin)
textattrs=(color=blue size=8pt);
yaxis display=(nolabel noticks noline) reverse grid gridattrs=(pattern=dot color=gray88);
xaxis display=(nolabel noticks noline novalues) type=discrete;
run;

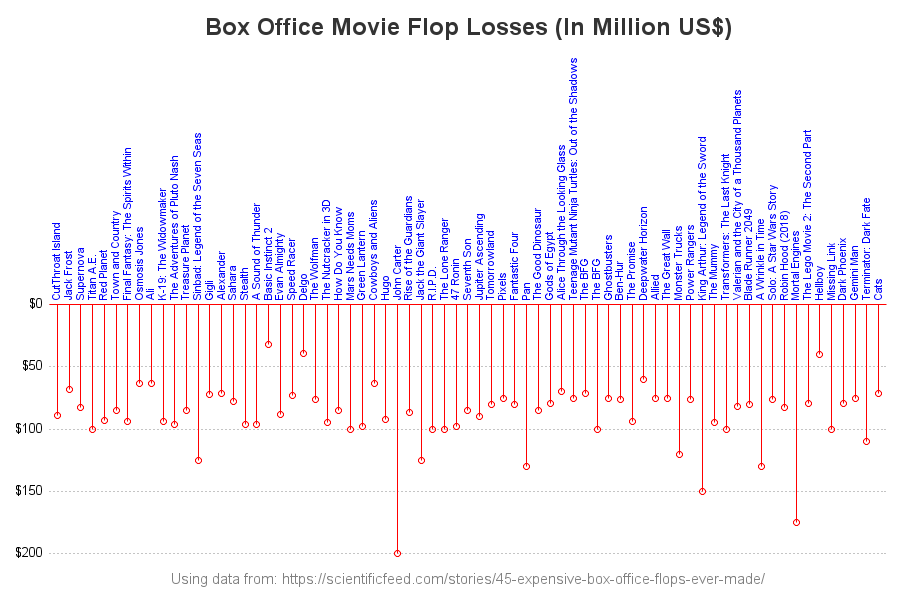
Final Version
If you've got a sharp eye, you noticed two of the movie titles overlapping(near the right-side of the graph). Although the discrete option causes each unique date value along the xaxis to be plotted separately, there happened to be two movies released on the exact same date ... therefore they were plotted on the exact same discrete xaxis value.
To get around that problem, I added a variable (called order) to the dataset, containing a unique value for each movie. Then I plotted the list by that unique value, instead of the date. I also enhanced the graph by adding mouse-over text and drilldown, using the tip= and url= options. (Click here to try out these interactive capabilities.)
data my_data; set my_data;
order=_n_;
run;
proc sgplot data=my_data noautolegend noborder;
needle x=order y=loss_millions / lineattrs=(color=red) markers markerattrs=(color=red)
url=drill tip=(title loss_millions date);
text x=order y=text_y text=title / position=right rotate=90 contributeoffsets=(ymin)
textattrs=(color=blue size=8pt)
url=drill tip=(title loss_millions date);
yaxis display=(nolabel noticks noline) reverse grid gridattrs=(pattern=dot color=gray88);
xaxis display=(nolabel noticks noline novalues) type=discrete;
run;
Click the image below, to see the interactive version, with mouse-over text, and drilldown links to find out more info about each movie. (Click here to see the full SAS code used to create this graph.)
Since these movies were flops (lost lots of money), you might not have seen them ... but also since these were big-budget movies, perhaps some of them are actually pretty good (if you happen to be into their topic/genre/etc). So, if you've run out of ideas for movies to watch, perhaps you will find something in this list. 🙂
If you find a movie in this list that you like(d), and think that other people reading a graph blog might also like, please leave a note/recommendation in the comments!


4 Comments
Rober,
Add a block(or text) to display the year would look like better.
data my_data;
label title='Movie';
label date='Release Date';
label loss_millions='Millions Lost';
length title $100;
format date date9.;
format loss_millions dollar20.0;
infile datalines dlm='|';
input date date9. loss_millions title;
text_y=-3;
drill="http://www.google.com/search?q="||trim(left(title))||', '||trim(left(put(date,year4.)));
year=year(date);
datalines;
16jun2000|100|Titan A.E.
15aug2002|96|The Adventures of Pluto Nash
06feb2015|90|Jupiter Ascending
27may2016|70|Alice Through the Looking Glass
01mar2013|125|Jack the Giant Slayer
25dec2013|98|47 Ronin
17dec2010|85|How Do You Know
22jun2013|100|The Lone Ranger
23feb2017|120|Monster Trucks
12dec2008|39|Delgo
07aug2015|80|Fantastic Four
19jun2013|100|R.I.P.D.
29jul2011|63|Cowboys and Aliens
19aug2016|76|Ben-Hur
28sep2016|60|Deepwater Horizon
22may2015|80|Tomorrowland
11sep2016|94|The Promise
27nov2018|174.8|Mortal Engines
22dec1995|89|CutThroat Island
20sep2015|130|Pan
08apr2005|78|Sahara
09mar2012|200|John Carter
08may2017|150|King Arthur: Legend of the Sword
02jul2003|125|Sinbad: Legend of the Seven Seas
03jun2016|75|Teenage Mutant Ninja Turtles: Out of the Shadows
22mar2017|76|Power Rangers
11mar2011|100|Mars Needs Moms
09may2008|73|Speed Racer
01aug2003|72|Gigli
29jul2005|96|Stealth
25nov2015|85|The Good Dinosaur
22jun2007|88|Evan Almighty
09jun2017|95|The Mummy
11dec1998|68|Jack Frost
24jul2015|75|Pixels
11jul2016|75|Ghostbusters
02jul2001|94|Final Fantasy: The Spirits Within
23nov2011|92|Hugo
12feb2010|76|The Wolfman
07aug2001|63|Osmosis Jones
21nov2012|87|Rise of the Guardians
27apr2001|85|Town and Country
27nov2002|85|Treasure Planet
17dec2014|85|Seventh Son
25dec2001|63|Ali
14jan2000|83|Supernova
09nov2016|75|Allied
24nov2004|71|Alexander
15jun2011|98|Green Lantern
26feb2016|79|Gods of Egypt
31mar2006|32|Basic Instinct 2
12apr2019|40|Hellboy
03oct2019|75|Gemini Man
10nov2000|93|Red Planet
19jul2002|94|K-19: The Widowmaker
24nov2010|95|The Nutcracker in 3D
02sep2005|96|A Sound of Thunder
26feb2018|130|A Wrinkle in Time
23oct2019|110|Terminator: Dark Fate
12apr2019|100|Missing Link
20jun2017|100|Transformers: The Last Knight
20nov2018|83|Robin Hood (2018)
21jul2017|82|Valerian and the City of a Thousand Planets
07jun2019|79|Dark Phoenix
06oct2017|80|Blade Runner 2049
08feb2019|79|The Lego Movie 2: The Second Part
10may2018|76|Solo: A Star Wars Story
05dec2016|75|The Great Wall
30jun2016|71|The BFG
20dec2019|71|Cats
;
run;
proc sort data=my_data out=my_data;
by date loss_millions;
run;
data my_data; set my_data;
order=_n_;
run;
ods graphics /
imagemap tipmax=2500
imagefmt=png
width=900px height=600px noborder;
proc sgplot data=my_data noautolegend noborder;
needle x=order y=loss_millions / lineattrs=(color=red) markers markerattrs=(color=red)
url=drill tip=(title loss_millions date);
text x=order y=text_y text=title / position=right rotate=90 contributeoffsets=(ymin)
textattrs=(color=blue size=8pt)
url=drill tip=(title loss_millions date);
yaxis display=(nolabel noticks noline) reverse grid gridattrs=(pattern=dot color=gray88);
xaxis display=(nolabel noticks noline novalues) type=discrete offsetmax=0.1 offsetmin=0.1;
block x=order block=year/ transparency=0.5 filltype=alternate labelpos=bottom ;
run;
Hmm ... it gets a little crowded, but an interesting idea!
Maybe showing groups of 5 or 10 years, instead of each year?
I think could use TEXT + rotate=90 to replace these years .
One of my favorite podcasts is The Flop House, in which 3 (nerdy) comedic writers watch a bad movie (usually a box office flop) and then talk about it. They have covered most of the movies in your report.