Have you been stuck at home, dreaming up the next big trip you'll take after this pandemic is over? How will you pick a really cool location to visit?
Perhaps you can ask your friends for suggestions. My co-worker (and lunch buddy) John recommended the Grand Prismatic Spring. Here's a picture he took:
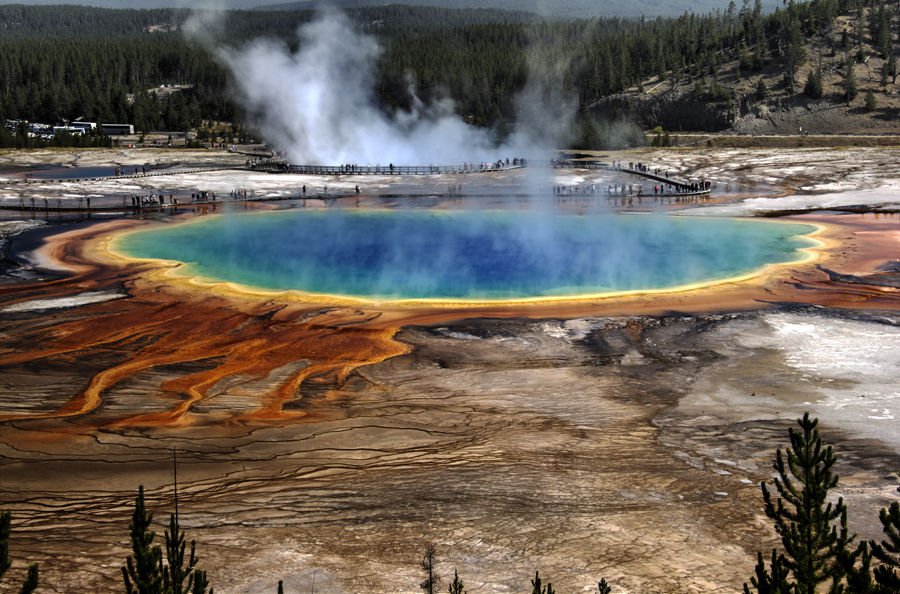
Now I know what the Grand Prismatic Spring looks like ... but where is it located? After a bit of Google searching, I found it was in the US Midwest, in Yellowstone Park.
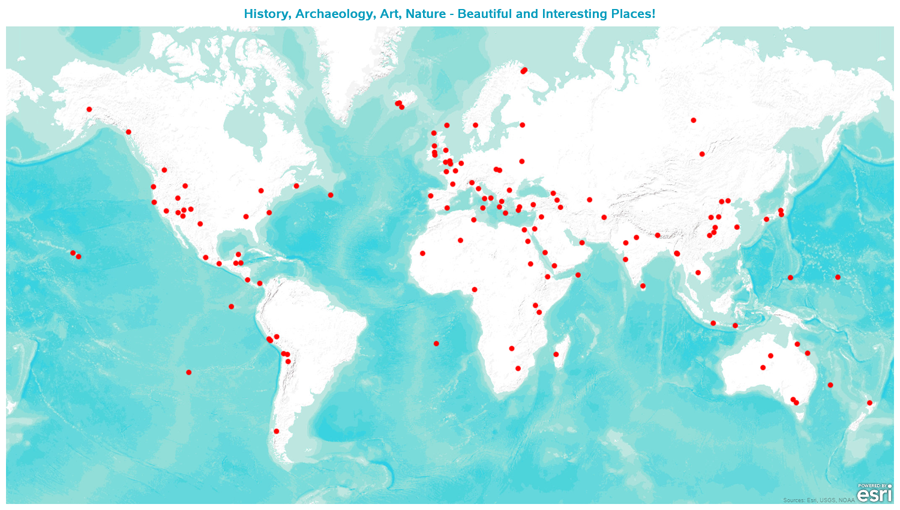
All that manual effort was fine for one potential location ... but what if I wanted to investigate dozens (or hundreds) of places? Being a computer guy, I wanted to use my programming skills to make this process more efficient! I came up with a list of cool potential places to visit around the world, and then plotted them all on an interactive map. The map allows me to quickly see where they are located, and then I can click the markers to launch a Google search and see pictures and more details about each location.
Here's my map if you'd like to see some of the places I think are cool (click the image below to see the interactive version of the map with mouse-over text and drilldown links):
If you're just looking for cool places to visit, you can stop here and use the map above!
If you're a programmer, and interested in how to create maps like this in SAS, then keep reading below!...
How'd he do that?
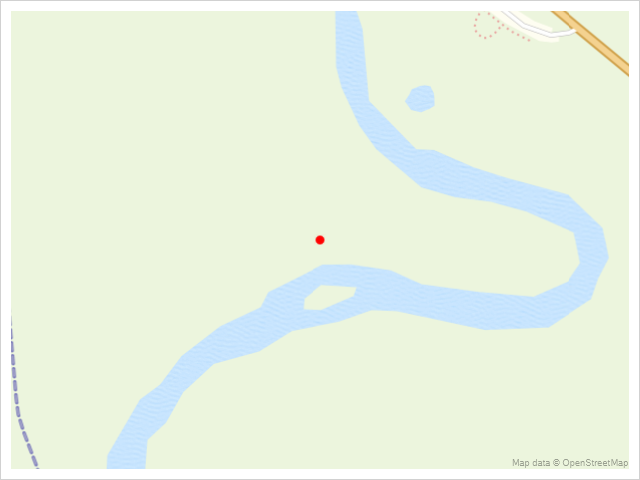
With the new Proc SGmap in SAS, it's easy to plot latitude/longitude coordinates on a map. For example, here's how to plot the lat/long for the Grand Prismatic Spring:
data marker_data;
lat=44.52; long=-110.83; description='Grand Prismatic Spring';
run;
proc sgmap plotdata=marker_data noautolegend;
openstreetmap;
scatter x=long y=lat / markerattrs=(symbol=circlefilled size=8pt color="red");
run;
One feature/caveat about SGmap ... it automatically zooms-in to show only the map area needed to accommodate the data being plotted. If you want to include a larger map area, you can add some other data to plot. Sometimes I add the points for the outline of a specific country or state. In this case, I added corner coordinates for the rectangular area I wanted to show (basically, the whole world map, minus the areas to the extreme north and south). You could specify four coordinates if you want ... but since the map is always rectangular, you really only need to specify the coordinates for two diagonal corners (such as bottom-left and top-right). When I plot these corner markers on the map, I use a size=0 so they're invisible.
data map_corners;
lat_corner=-55; long_corner=-180; output;
lat_corner=70; long_corner=180; output;
run;
data all_data; set marker_data map_corners;
run;
ods graphics / width=1500px height=850px noborder;
proc sgmap plotdata=all_data noautolegend;
openstreetmap;
scatter x=long y=lat / markerattrs=(symbol=circlefilled size=8pt color="red");
scatter x=long_corner y=lat_corner / markerattrs=(symbol=circle size=0pt color="white");
run;
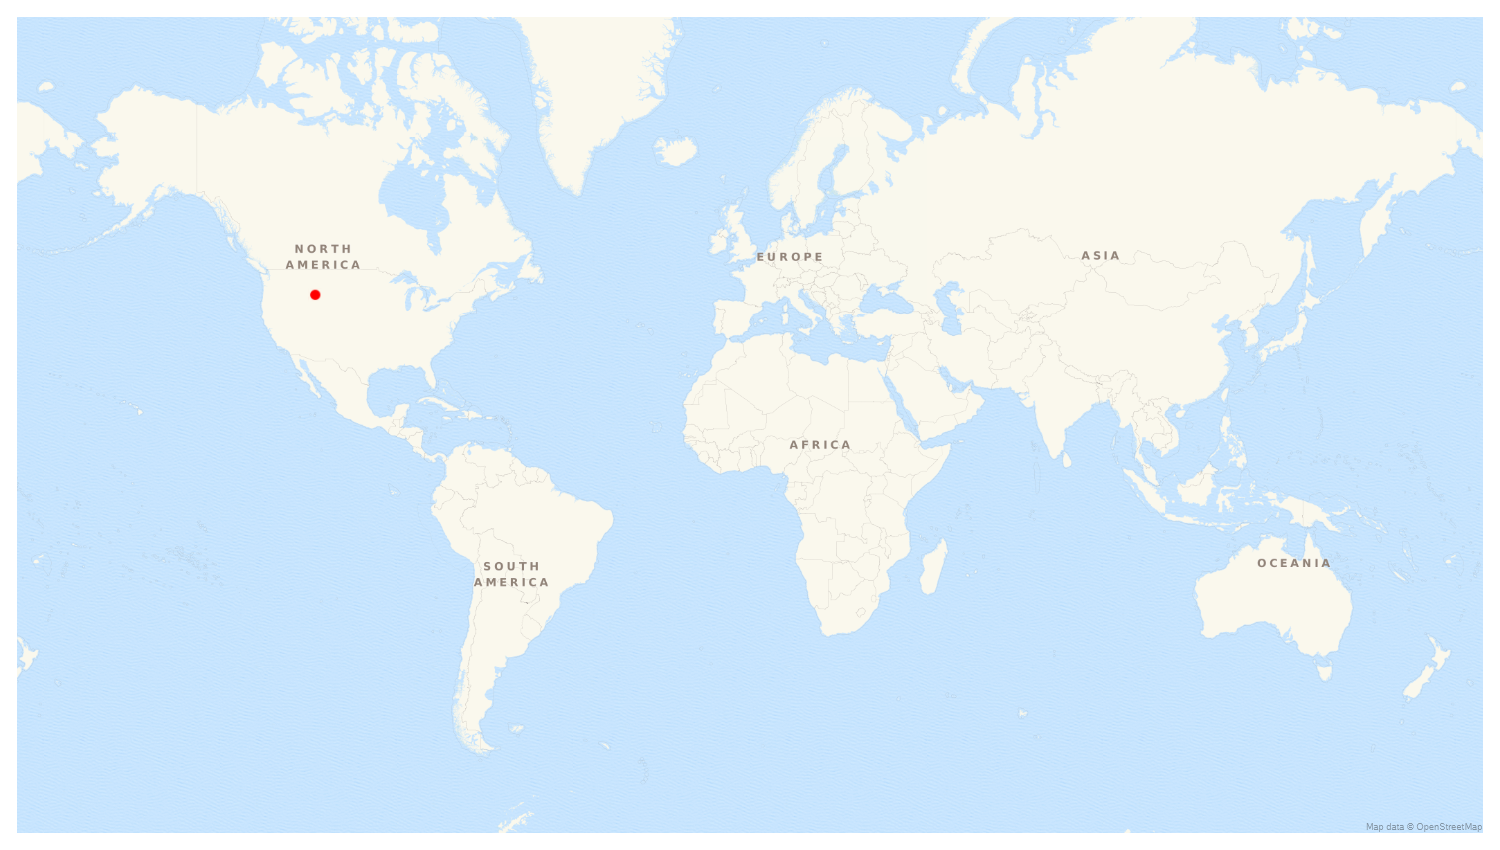
Note that getting the map area you want to be visible might require a bit of trial-and-error. The background map is composed of map tiles, and exactly which tiles are shown depends on the width and height of the map, in combination with the extent of the lat/long data values being plotted. You can't directly control exactly which tiles are shown. So, spend enough time to get it close to what you want, but don't waste too much time & frustration trying to get to get the map to display an exact area!
The world map above is OK ... but let's make it better. The Openstreetmap background is easy to use (just a simple single-word SGmap option), but the Openstreetmaps include labels and roads (and since they're tile maps, you can't get rid of labels, etc). SGmap also allows you to use Esri tile maps in the background, and some of those tile maps just show terrain (with no labels or roads). Here's the one I chose to use:
proc sgmap plotdata=all_data noautolegend;
esrimap url="http://services.arcgisonline.com/arcgis/rest/services/World_Terrain_Base";
scatter x=long y=lat / markerattrs=(symbol=circlefilled size=8pt color="red");
scatter x=long_corner y=lat_corner / markerattrs=(symbol=circle size=0pt color="white");
run;

With just one marker, it's easy for me to remember that it represents the Grand Prismatic Spring. But with dozens of markers it would be difficult for me to keep track of which marker is which ... and if other people viewed my map, they would have no idea what the markers represent. Therefore I use the SGmap tips= option to have the value of the description variable shown in mouse-over text, and the url= option to point to a variable that will launch a Google search for the text in the description variable. (Note that you must turn on the ods graphics' imagemap option, to utilize the tips= and url= options). [The first bit of code below is what you could add to your marker_data dataset.]
length searchlink $300;
searchlink='http://images.google.com/images?q='||trim(left(Description));
ods graphics / imagemap;
proc sgmap plotdata=all_data noautolegend;
esrimap url="http://services.arcgisonline.com/arcgis/rest/services/World_Terrain_Base";
scatter x=long y=lat / markerattrs=(symbol=circlefilled size=8pt color="red")
url=searchlink tip=(Description);
scatter x=long_corner y=lat_corner / markerattrs=(symbol=circle size=0pt color="white");
run;
Click here if you'd like to download the full SAS code used to create the map. Note that you'll need the most recent version (SAS 9.4 maintenance 7) to use the new SGmap url= and tip= options.
Did you find any locations on this map you'd like to visit? Are there any you'd like to add to the map? (feel free to discuss in the comments section...)


4 Comments
Love seeing how mapping syntax has evolved. Thanks for sharing what's new with PROC SGMAP and the cool places you'd like to visit.
In terms of future travel wishlist, I'm wishing the world becomes a healthier and safer place for all in 2021.
Much obliged for sharing for data..
Happy retirement, for a guy like you that like Boating/ hiking going by Maps I would strongly reccomend a visit to Norway.
Sounds like a great idea! 🙂