
How can retailers start to navigate the current market volatility and risks and mitigate supply chain disruption?

How can retailers start to navigate the current market volatility and risks and mitigate supply chain disruption?
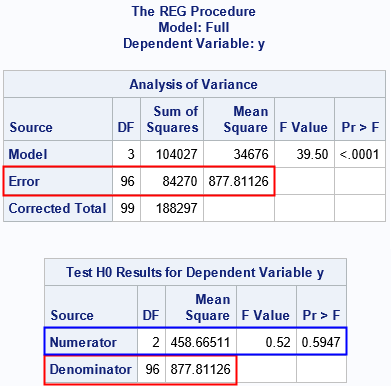
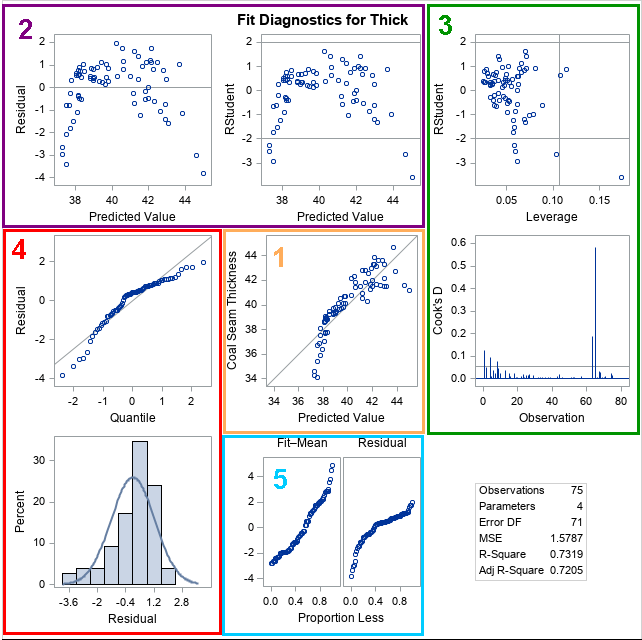
On a SAS discussion forum, a statistical programmer asked about how to understand the statistics that are displayed when you use the TEST statement in PROC REG (or other SAS regression procedures) to test for linear relationships between regression coefficients. The documentation for the TEST statement in PROC REG explains
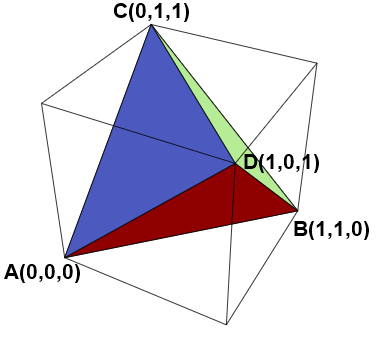
One of the benefits of social media is the opportunity to learn new things. Recently, I saw a post on Twitter that intrigued me. The tweet said that the expected volume of a random tetrahedron in the unit cube (in 3-D) is E[Volume] = 0.0138427757.... This number seems surprisingly small!

A previous article discusses the definitions of three kinds of moments for a continuous probability distribution: raw moments, central moments, and standardized moments. These are defined in terms of integrals over the support of the distribution. Moments are connected to the familiar shape features of a distribution: the mean, variance,

SAS is excited to announce our inaugural Customer Appreciation Awards. We want to give a big “thank you” and a round of applause to all our SAS customers and partners around the globe who help us change the world through analytics. We want to recognize a few of you for
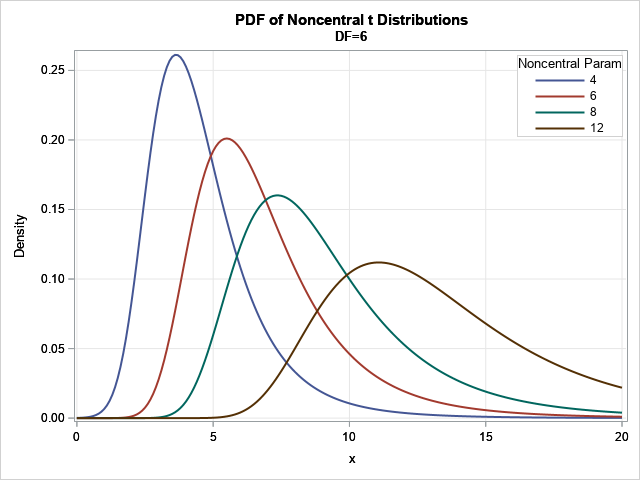
The moments of a continuous probability distribution are often used to describe the shape of the probability density function (PDF). The first four moments (if they exist) are well known because they correspond to familiar descriptive statistics: The first raw moment is the mean of a distribution. For a random

Many parents when naming their children, want to choose a name that they like, but that isn’t so popular that everywhere they go they hear it being called. But even for the most popular girls’ and boys’ names, how likely is it that there will be children with the same

To help burgeoning data researchers apply data analysis skills across policy sectors in economic, health and social science-informed areas of study, they need both policy and data industry experts to help them develop these critical skills before they graduate. The National Policy Challenge was developed with this goal in mind.
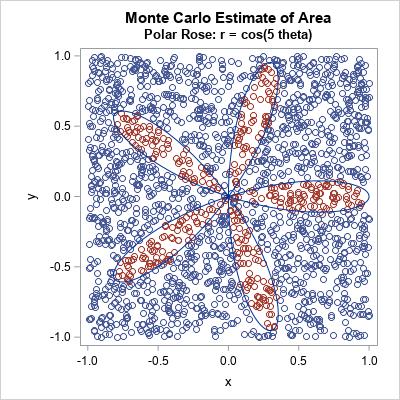
I've previously shown how to use Monte Carlo simulation to estimate probabilities and areas. I illustrated the Monte Carlo method by estimating π ≈ 3.14159... by generating points uniformly at random in a unit square and computing the proportion of those points that were inside the unit circle. The previous

SAS is pleased to announce a new ModelOps certification. Recognizing the growing need in this emerging area, this new credential will help create a standard of knowledge within the area of ModelOps.

Robert Handfield, PhD, is a distinguished professor of Supply Chain Management at North Carolina State University and Director of the Supply Chain Resource Cooperative. In an episode of the Health Pulse Podcast, Handfield gave his views regarding the challenges health care and life science companies have encountered over the past two years

There’s plenty of buzz about innovation and thinking outside of the box at SAS these days. But for those who attended SAS' Patent Dinner, the proof was in the patent. SAS Legal Counsel Director Tim Wilson offered opening remarks at The Umstead event. “So much of what we do in

SAS can generate animations in GIF or SVG format. The SAS system option ANIMDURATION can specify the duration of a frame corresponding to the appropriate FPS.
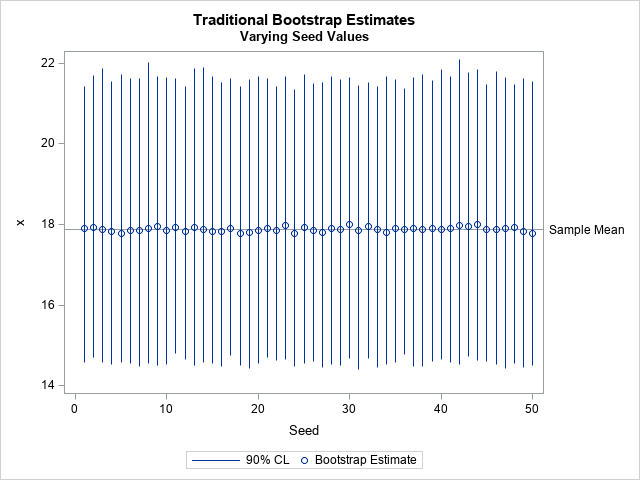
Many modern statistical techniques incorporate randomness: simulation, bootstrapping, random forests, and so forth. To use the technique, you need to specify a seed value, which determines pseudorandom numbers that are used in the algorithm. Consequently, the seed value also determines the results of the algorithm. In theory, if you know
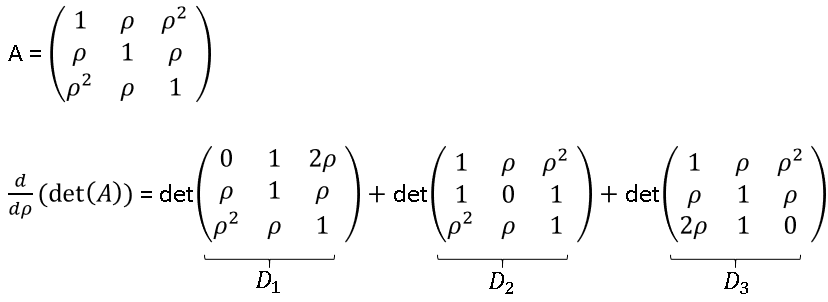
Did you know that there is a mathematical formula that simplifies finding the derivative of a determinant? You can compute the derivative of a determinant of an n x n matrix by using the sum of n other determinants. The n determinants are for matrices that are equal to the original matrix
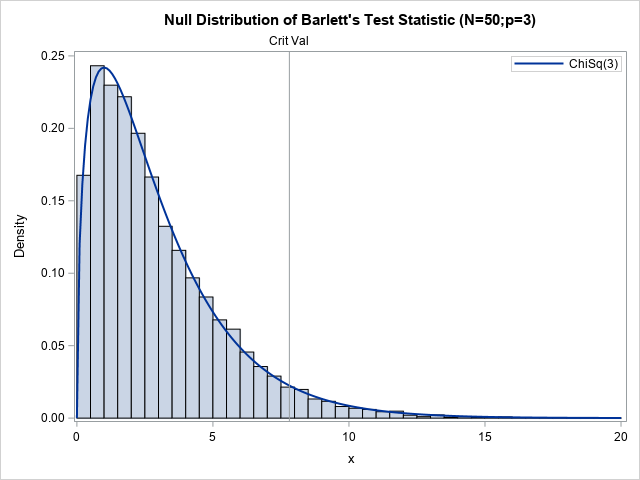
Recently, I wrote about Bartlett's test for sphericity. The purpose of this hypothesis test is to determine whether the variables in the data are uncorrelated. It works by testing whether the sample correlation matrix is close to the identity matrix. Often statistics textbooks or articles include a statement such as

As companies continue to amass zettabytes of data, the talent hunt for data scientists who can create clarity out of all the noise, has never been greater. But one of the greatest challenges a data scientist faces is communicating the uncovered insights wrangled from the relevant data to decision-makers. To

Traffic collisions are the second leading cause of firefighter deaths in the United States and most of these collisions occur at intersections. That statistic, together with a vision to apply a combination of AI and IoT to find a solution for all emergency vehicle collisions inspired the Team Hackanadians in

While studying business intelligence as an undergraduate student at business school HEC Montreal, Camille Duchesne encountered Cortex, an analytics simulation that pits participants against each other to develop the most accurate models for a particular task. In this case, the simulation supports a fictional charity by predicting which subjects from

Several probability distributions model the outcomes of various trials when the probabilities of certain events are given. For some distributions, the definitions make sense even when a probability is 0. For other distributions, the definitions do not make sense unless all probabilities are strictly positive. This article examines how zero
On this blog, I write about a diverse set of topics that are relevant to statistical programming and data visualization. In a previous article, I presented some of the most popular blog posts from 2021. The most popular articles often deal with elementary or familiar topics that are useful to
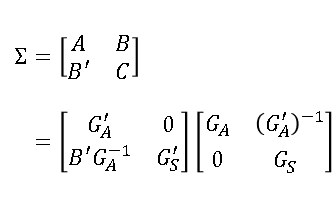
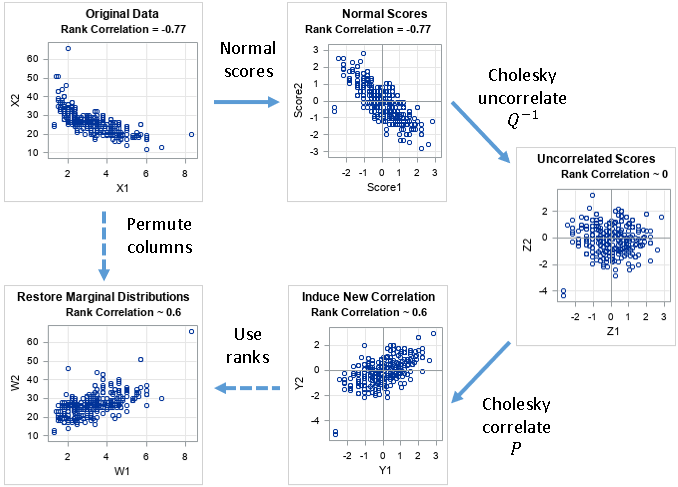
You can use the Cholesky decomposition of a covariance matrix to simulate data from a correlated multivariate normal distribution. This method is encapsulated in the RANDNORMAL function in SAS/IML software, but you can also perform the computations manually by calling the ROOT function to get the Cholesky root and then
Last year, I wrote almost 100 posts for The DO Loop blog. My most popular articles were about data visualization, statistics and data analysis, and simulation and bootstrapping. If you missed any of these gems when they were first published, here are some of the most popular articles from 2021:

There is no shortage of challenges associated with the deployment of AI: a lack of access to infrastructure, a lack of skills, and new legislation meant to enforce the responsible use of this evolving technology. But the most consequential questions facing us are innately human. Namely, ensuring human agency, safety

While discussing how to compute convex hulls in SAS with a colleague, we wondered how the size of the convex hull compares to the size of the sample. For most distributions of points, I claimed that the size of the convex hull is much less than the size of the
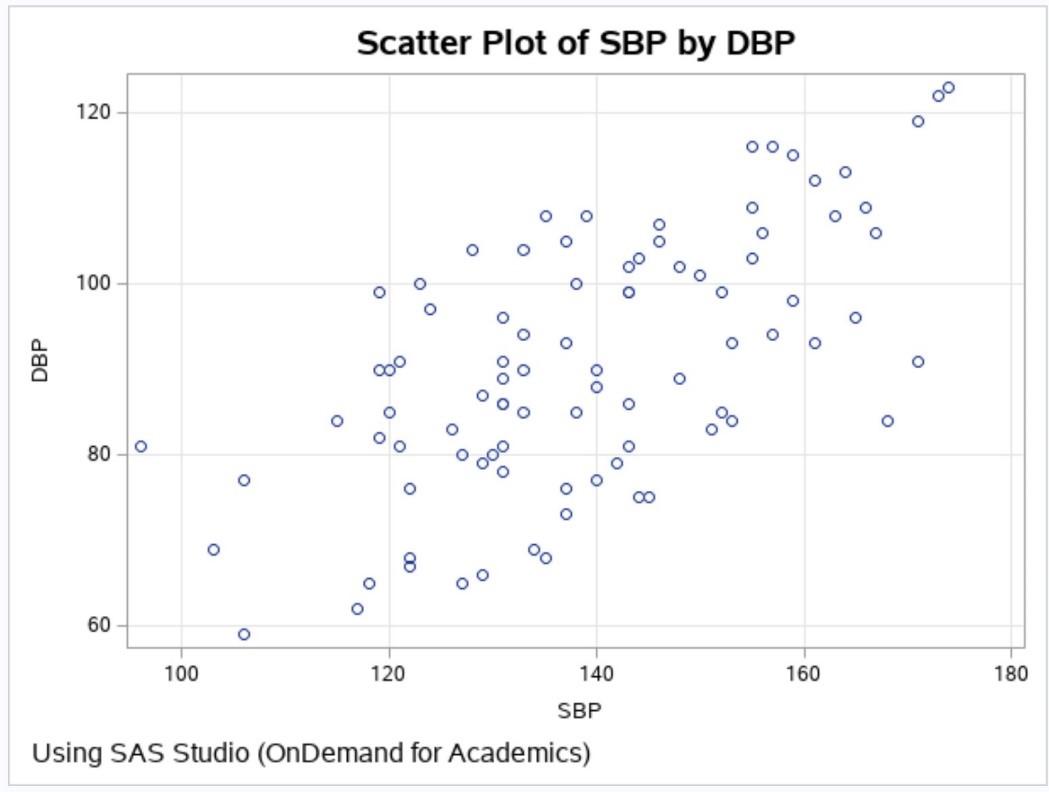
This blog is a continuation of a previous blog that discussed creating simulated data sets. If you have not seen it, you might want to review it, especially if you are not familiar with the RAND function. The program that I'm going to show you simulates a drug study with
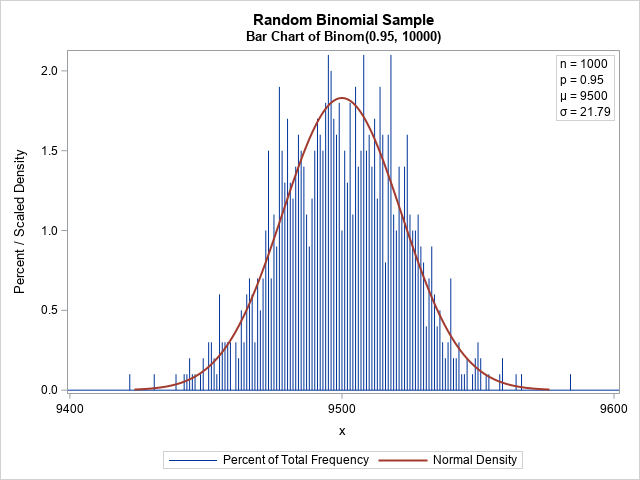
Recall that the binomial distribution is the distribution of the number of successes in a set of independent Bernoulli trials, each having the same probability of success. Most introductory statistics textbooks discuss the approximation of the binomial distribution by the normal distribution. The graph to the right shows that the

There are times when it is useful to simulate data. One of the reasons I use simulated data sets is to demonstrate statistical techniques such as multiple or logistic regression. By using SAS random functions and some DATA step logic, you can create variables that follow certain distributions or are

A previous article discusses how to use SAS regression procedures to fit a two-parameter Weibull distribution in SAS. The article shows how to convert the regression output into the more familiar scale and shape parameters for the Weibull probability distribution, which are fit by using PROC UNIVARIATE. Although PROC UNIVARIATE

SAS' Bahar Biller, an operations researcher, details how to develop a supply chain digital twin.