One of the benefits of social media is the opportunity to learn new things. Recently, I saw a post on Twitter that intrigued me. The tweet said that the expected volume of a random tetrahedron in the unit cube (in 3-D) is E[Volume] = 0.0138427757.... This number seems surprisingly small! After all, the cube has unit volume, and the volume of the largest tetrahedron in the cube is 1/3. So, the result says that the average volume of a random tetrahedron is 24 times smaller than the largest tetrahedron!
The result is attributed to Zinani, A. (2003) "The Expected Volume of a Tetrahedron whose Vertices are Chosen at Random in the Interior of a Cube," which is behind a paywall. The abstract says that the analytical result is exactly
E[Volume] = 3977 / 216000 - π2 / 2160
and that this number is
"in convincing agreement with a simulation."
This article shows how to run a Monte Carlo simulation in SAS to simulate random tetrahedra and compute their volumes. We use the simulation to confirm Zinani's result and to visualize the distribution of the volume.
The volume of a tetrahedron
In multivariable calculus, students are introduced to the scalar triple product of three vectors. Given three vectors u, v, and w, the scalar triple product is the quantity (u x v)⋅w, where (u x v) is the cross product of the vectors, and z⋅w = zT*w is the scalar dot product. The scalar triple product is the (signed) volume of the parallelepiped formed by the vectors.
Recall that the volume of a tetrahedron with vertices (A,B,C,D) is 1/6 of the volume
of the parallelepiped formed by the vectors between vertices. Consequently, the volume of a tetrahedron is
V = 1/6 |(AB x AC)⋅AD|
where
AB is the vector from A to B,
AC is the vector from A to C, and
AD is the vector from A to D.
Compute the volume of a tetrahedron in SAS
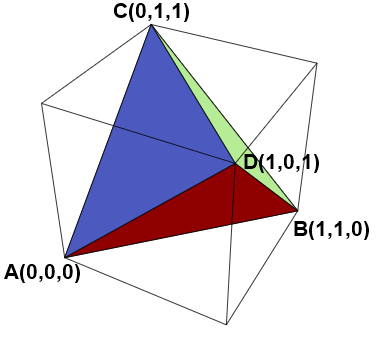
Since the volume formula includes vectors and vector operations, it is natural to use the SAS/IML language to compute the volume. The following functions implement the definition of the vector cross-product. To test the function, the program computes the volume of the largest tetrahedron that can be imbedded in the unit cube. One such tetrahedron is shown to the right. The tetrahedron has vertices A(0,0,0), B(1,1,0), C(0,1,1), and D(1,0,1). The volume of this tetrahedron is 1/3, as shown by the following program.
/* volume of tetrahedron in 3D */ proc iml; /* vector cross product (3D vectors only) https://blogs.sas.com/content/iml/2013/05/20/matri-multiplication.html */ start CrossProd(u, v); i231 = {2 3 1}; i312 = {3 1 2}; return( u[i231]#v[i312] - v[i231]#u[i312] ); finish; start VolumeTetra(A,B,C,D); z = CrossProd(B-A, C-A); /* z = AB x AC */ w = colvec(D - A); /* w = AD */ volume = abs(z`*w) / 6; /* V = 1/6 | z`*w | */ return( volume ); finish; /* test the formula: compute the volume of the largest tetrahedron inside the unit cube */ A = {0 0 0}; B = {1 1 0}; C = {0 1 1}; D = {1 0 1}; maxVol = VolumeTetra(A,B,C,D); print maxVol; |

A Monte Carlo simulation of random tetrahedron
It is not hard to write a SAS/IML program that generates four random vertices for a tetrahedron inside the unit cube in 3-D. To generate the four vertices, you can generate 12 uniform variates independently in the interval [0,1]. Assign the first three numbers to be the (x,y,z) Euclidean coordinates of the first vertex, the next three numbers to be the coordinates of the second vertex, and so forth. From the vertices, you can call the VolumeTetra function to produce the volume.
The following program generates 100,000 random tetrahedra and computes their volumes. The program then calls the MEAN function computes the average volume, which is the Monte Carlo estimate of the expected value.
call randseed(1234); N = 1E5; X = randfun(N//12, "Uniform"); /* Z x 12 matrix of uniform variates */ Vol = j(N, 1, .); /* allocate array for volumes */ do i = 1 to N; A = X[i, 1:3]; B = X[i, 4:6]; /* form four vertices from the 12 random numbers */ C = X[i, 7:9]; D = X[i, 10:12]; Vol[i] = VolumeTetra(A,B,C,D); end; avgVol = mean(Vol); /* Monte Carlo estimate of mean */ expectedValue = 3977/216000 - constant('pi')**2 / 2160; /* Zinani's exact result for E[Volume] */ print avgVol expectedValue (expectedValue-avgVol)[L="Diff"]; |
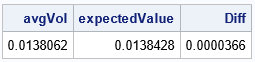
The output shows that the Monte Carlo estimate is very close to the expected value. This confirms Zinani's result: the average volume of a random tetrahedron is smaller than you might think.
Visualize the distribution of volumes
The expected value for the distribution of tetrahedral volumes is small. Since we know that at least one tetrahedron has a relatively large value (1/3), we might conjecture that most of the tetrahedra have very small volumes and only a few have larger volumes. A way to test that conjecture is to visualize the distribution by drawing a histogram of the volumes for the 100,000 random tetrahedra. The following SAS/IML statements write the expected value to a macro variable and write the volumes of the random tetrahedra to a data set. PROC UNIVARIATE then computes descriptive statistics for the volumes and plots a histogram of the distribution of volumes:
/* E[Volume] = 3977 / 216000 - pi**2 / 2160 = 0.01384277574... */ call symputx("EV",expectedValue); /* write E[Volume] to a macro variable */ create Vol var "Vol"; append; close; /* write volumes to a data set */ QUIT; title "Volume of a Random Tetrahedron"; proc univariate data=Vol; histogram Vol / endpoints href=&EV odstitle=title; run; |
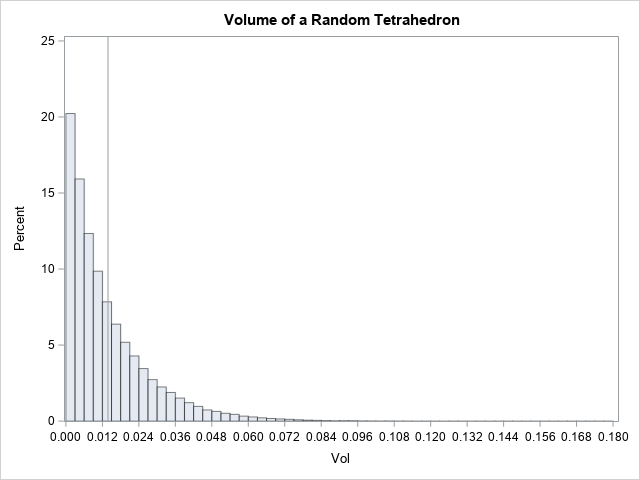
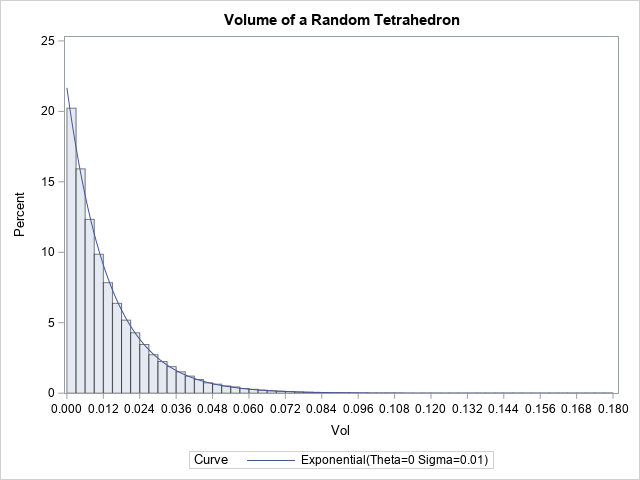
The graph indicates that a random tetrahedron is likely to have a volume that is near 0. The vertical line is the expected value of the distribution. Notice that only a small proportion of the tetrahedra have volumes that exceed 0.1. In this collection of 100,000 random tetrahedra, the largest volume was 0.1777, which is about 50% of the volume of the largest possible tetrahedron. The distribution has a long but thin tail.
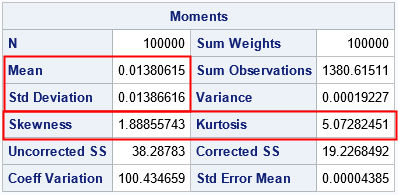
If you look carefully at the table of descriptive statistics (the "Moments" table), you will see that the mean and the standard deviation are nearly the same. This property is characteristic of an exponential distribution. An exponential distribution has a skewness of 2 and an excess kurtosis of 6. However, the sample skewness and sample kurtosis are biased statistics, and the estimates shown here (1.8 and 5.1, respectively) are typical for a large sample from an exponential distribution. This suggests that the tetrahedral volume is distributed as V ~ Exp(λ=E[Volume]). Let's use PROC UNIVARIATE again and overlay the density of the Exp(λ=0.0139) distribution. Furthermore, you can use a Q-Q plot to visualize how well the exponential model fits the simulated volumes.
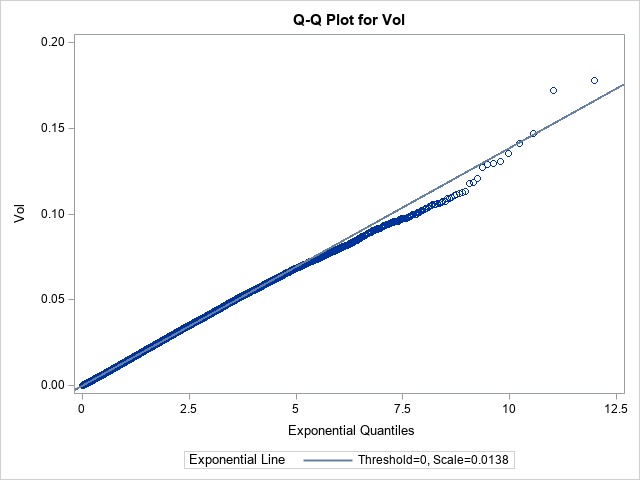
proc univariate data=Vol; histogram Vol / exponential(theta=0 sigma=&EV) endpoints; qqplot Vol / exponential(theta=0 sigma=&EV); run; |
The fit is excellent! Not only does the density curve overlay perfectly on the histogram, but the quantiles of the data (not shown) are in excellent agreement with the expected quantiles of the exponential distribution. If you look at the Q-Q plot, you again see excellent agreement between the data and the exponential model. The only shortcoming is that the simulated volumes have fewer extreme values than predicted by the model.
The model enables you to compute the probability of certain events. For example, the probability that a random tetrahedron has volume greater than 0.1 is 1-cdf("Expo", 0.1, &EV), which is 0.00073.
Summary
A result by Zinani (2003) gives the expected volume of a tetrahedron whose vertices are chosen uniformly at random in the unit cube. Zinani's result is E[Volume] = 0.0138427757.... Although this number seems surprisingly small, the expected value is confirmed by using a Monte Carlo simulation in SAS. The simulation suggests that the volumes are exponentially distributed.
For an alternative mathematical proof of the result, see Philip, J. (2007) "The Expected Volume of a Random Tetrahedron in a Cube", which is free to view and is very well written.

3 Comments
What an amazing article! I really enjoyed reading it, congratulations!
It's always great to see a Monte Carlo simulation for checking the validity of the theoretical result as there are up to now only 8 regular polyhedra for which the exact expected random tetrahedron volume is known in closed form. Apart of regular polyhedra, I think also the distribution is known exactly in case of a ball.
Thanks for sharing!