On this blog, I write about a diverse set of topics that are relevant to statistical programming and data visualization. In a previous article, I presented some of the most popular blog posts from 2021. The most popular articles often deal with elementary or familiar topics that are useful to almost every data analyst. However, I also write articles that discuss more advanced topics. Did you make a New Year's resolution to learn something new this year? Here is your chance! The following articles deserve a second look. I have grouped them into four categories: SAS programming, statistics, optimization, and data simulation.
SAS programming
For years, I've been writing articles about how to accomplish tasks in Base SAS. In addition, I now write about how to program basic tasks in SAS Viya.
- The DOLIST syntax: The DOLIST syntax enables you to specify a sequence of numeric values. A sequence is specified by using the start TO step BY increment syntax. The DOLIST syntax is valid in many SAS procedures and in the DATA step.
- Use FCMP to define a function: I regularly remind programmers that they can use PROC FCMP to implement custom functions that can be called from the DATA step. In this article, I show how to implement a PRODUCT function that handles missing values.
- What is a caslib?: SAS Viya is the future of SAS. In Viya, you can access data by using a caslib, which is similar to (but different from) a libref in traditional SAS. Learn how to define and use caslibs to access data in CAS.
- How to find SAS documentation on a topic: Because there is a lot of overlap between SAS 9 and SAS Viya, it can be difficult to find the most recent documentation for the SAS product and version that you are using. This article describes some search engine tricks that can help you locate the SAS documentation that you need.
Probability and statistics
Probability and statistics provide the theoretical basis for modern data analysis. You cannot understand data science, machine learning, or artificial intelligence without understanding the basic principles of statistics. Most readers are familiar with common probability distributions, Pearson correlation, and least-squares regression. The following articles discuss some of the lesser-known statistical cousins of these topics:
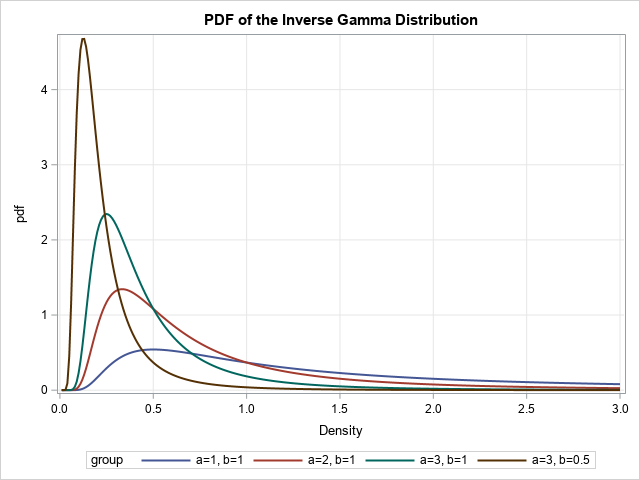
- The inverse gamma distribution: To use any probability distribution, you need to know four essential functions: the density, the cumulative probability, the quantiles, and how to generate random variates. You might be familiar with the gamma distribution, but what is the inverse gamma distribution and how do you define the four essential functions in SAS? Similarly, what is the generalized gamma distribution?
- The Hoeffding D statistic: The Hoeffding D statistic measures the association between two variables. How do you compute the Hoeffding D statistic in SAS, and how do you interpret the results?
- Weibull regression: In ordinary least squares regression, the response variable is assumed to be modeled by a set of explanatory variables and normally distributed errors. If the error terms are Weibull distributed, you can estimate parameters for the Weibull distribution as part of a regression analysis, but you need to transform the regression estimates to obtain the usual Weibull parameters.
Optimization
Optimization is at the heart of many statistical techniques, such as maximum likelihood estimation. But sometimes you need to solve a "pure" optimization problem. SAS supports many methods for solving optimization problems:
- The knapsack problem: The classic knapsack problem is an example of an optimization in which the components of the solution vector are binary (0/1) values. This article shows how to solve the knapsack problem as a mixed integer linear programming problem by using the MILPSOLVE function in SAS/IML or the MILP solver in PROC OPTMODEL.
- Genetic algorithms A genetic algorithm is a heuristic optimization technique. You can read about how to define and solve a genetic algorithm problem in SAS.
Multivariate simulation and bootstrapping
It is straightforward to simulate univariate data. It is harder to simulate multivariate data while preserving important relations between the variables, such as correlation. Similarly, it can be challenging to analyze the bootstrap distribution of a multivariate statistic, such as a correlation matrix:
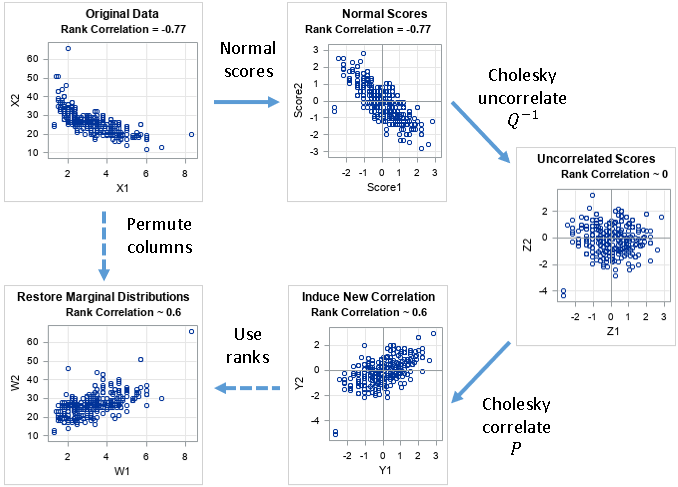
- The Iman-Conover method for simulation: I wrote about the Iman-Conover method for simulating multivariate correlated data in Simulating Data with SAS (Wicklin, 2013). It remains a favorite nonparametric method for simulating multivariate data because it works well and because you can understand the Iman-Conover method as a series of geometric transformations.
- Copulas: Copulas provide the most powerful parametric method for simulating correlated multivariate data. If you are serious about simulating multivariate data, you need to learn how to simulate from copulas in SAS. Like the Iman-Conover method, copulas have a beautiful geometric interpretation in terms of transformations.
- Bootstrap correlation coefficients: It can be challenging to analyze the bootstrap distribution of a multivariate statistic. This article provides a step-by-step example of a bootstrap analysis of the Pearson correlation coefficients for multivariate data.
Your turn
Did I omit one of your favorite blog posts from The DO Loop in 2021? If so, leave a comment and tell me what topic you found interesting or useful.
