There are many statistics that measure whether two continuous random variables are independent or whether they are related to each other in some way. The most well-known statistic is Pearson's correlation, which is a parametric measure of the linear relationship between two variables. A related measure is Spearman's rank correlation, which uses ranks to construct a robust measure of the linear association between variables. Both statistics are available in PROC CORR in SAS.
There are other statistics that are less popular but have the advantage of being able to detect nonlinear relationships between variables. I have previously written about the distance correlation, which is a relatively new (2007) method of testing independence between two random variables, X and Y. An older method is Hoeffding's D statistic (1948), which can also detect departures from independence. Hoeffding's statistic measures independence by comparing the distributions of X, Y, and the joint distribution of X and Y. Like Spearman's correlation, Hoeffding's statistic is based on (tied) ranks of X and Y, but it also incorporates the bivariate ranks. Bivariate ranks are related to the joint distribution of X and Y.
Compute Hoeffding's D statistic in SAS
Hoeffding's D statistic is supported by PROC CORR in Base SAS. The following DATA step defines 33 observations. The X values are on the interval [-1, 1] and include only 11 distinct values. The Y variable is quadratically related to the X variable; it contains seven tied values.
data Sample; input x y @@; datalines; -1.0 2.03 -1.0 2.11 -1.0 2.03 -0.8 1.58 -0.8 1.79 -0.8 1.58 -0.6 1.35 -0.6 1.46 -0.6 1.37 -0.4 1.28 -0.4 1.15 -0.4 1.19 -0.2 0.93 -0.2 0.99 -0.2 0.99 -0.0 1.03 -0.0 0.98 -0.0 1.02 0.2 1.00 0.2 1.06 0.2 1.00 0.4 1.31 0.4 1.33 0.4 0.99 0.6 1.28 0.6 1.42 0.6 1.50 0.8 1.68 0.8 1.64 0.8 1.68 1.0 2.07 1.0 1.94 1.0 2.14 ; proc sgplot data=Sample; scatter x=x y=y; run; proc corr data=Sample pearson hoeffding; var x y; run; |
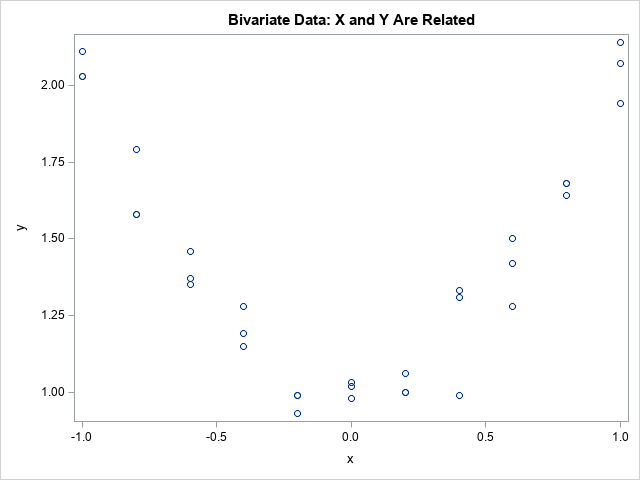
The graph shows a quadratic relationship between X and Y. The Pearson correlation between X and Y (not shown) is 0.008 and is not statistically different from 0. Thus, the Pearson correlation does not detect that X and Y are dependent. In contrast, the following table displays the matrix of Hoeffding's D statistics for the data. The first number in each cell is the D statistic. The second number is a p-value for a test of independence. The very small values indicate that we can reject the null hypothesis that the variables are independent (H0: D=0).
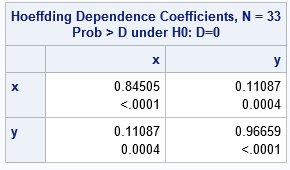
In contrast to a Pearson correlation matrix, the diagonal elements of the Hoeffding matrix, which show the association between a variable and itself, are not necessarily 1. If a variable does not contain any duplicate values, the D statistic will be 1. However, these data have duplicate values so the D statistics on the diagonal are less than 1. The Hoeffding statistic between Y and itself is close to 1 because Y has only a small number of duplicate values. The Hoeffding statistic between X and itself is smaller because there are more duplicate values for X. Notice that the D statistic between X and Y is 0.11, and the test for independence rejects the hypothesis of independence. Thus, the Hoeffding statistic concludes that that X and Y are not independent.
You can also compute the Hoeffding D statistic by using the CORR function in the SAS/IML language, which supports the "HOEFFDING" option. For example, the following statements compute the matrix of Hoeffding statistics for the Sample data:
proc iml; use Sample; read all var {x y} into X; close; D = corr(X, "Hoeffding"); print D[c={x y} r={x y}]; |
The D statitics are the same as for PROC CORR.
Bivariate ranks and Hoeffding's D statistic
The PROC CORR documentation includes a formula for the Hoeffding D statistic. It is not difficult to reproduce the PROC CORR output by implementing the formula in the SAS/IML language. Yes, this is a somewhat academic exercise, but sometimes implementing a formula or algorithm yourself provides insights that are not apparent when you use a built-in software function or procedure.
You can compute the D statistic for a pair of variables if you know the (tied) ranks of each variable and the bivariate ranks of the pairs of values. The following SAS/IML program uses the BRANKS function to computes these three sets of ranks and uses the ranks to compute the Hoeffding D statistic according to the formula. (The BRANKS function is described in a separate article.) The following program validates the PROC CORR computation for the variables in the previous section:
proc iml; use Sample; /* read the same variables that PROC CORR used */ read all var {x y}; close; /* manual computation of the Hoeffding D statistic by using the formula in the PROC CORR doc */ start HoeffdingDPair(x, y); /* handle missing values pairwise */ idx = loc( x^=. && y^=. ); /* Not enough observations for Hoeffding's D */ if ncol(idx)<5 then return(.); w = x[idx,] || y[idx,]; ranks = branks(w); R = ranks[,1]; S = ranks[,2]; Q = ranks[,3]; n = nrow(w); D1 = sum( (Q-1)#(Q-2) ); D2 = sum( (R-1)#(R-2)#(S-1)#(S-2) ); D3 = sum( (R-2)#(S-2)#(Q-1) ); D = 30* ((n-2)*(n-3)*D1 + D2 - 2*(n-2)*D3 ) / (n*(n-1)*(n-2)*(n-3)*(n-4)); return D; finish; Dxy = HoeffdingDPair(x,y); print Dxy; |

As expected, the formula in the documentation gives the same result as PROC CORR (and the CORR function in SAS/IML). You can compute all pairwise D statistics by iterating over the pairs of columns in a data matrix, as follows:
/* compute the Hoeffding D statistic for each pair of variables in a matrix */ start HoeffdingD(X); p = ncol(X); Dmatrix = j(p,p,.); do i = 1 to p; DMatrix[i,i] = HoeffdingDPair(X[,i], X[,i]); do j = i to p; DMatrix[i,j] = HoeffdingDPair(X[,i], X[,j]); DMatrix[j,i] = Dmatrix[i,j]; /* symmetric matrix */ end; end; return Dmatrix; finish; w = x||y; Dmat = HoeffdingD(w); print Dmat[r={x y} c={x y}]; |
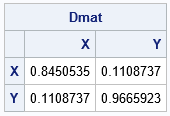
Again, the matrix validates the PROC CORR result.
As implemented, the SAS/IML function uses pairwise deletion of missing values, which is the default behavior for PROC CORR. However, if you want to use listwise deletion of missing values, you can form the matrix of complete cases before calling the HoeffdingD function.
Summary
You can compute the Hoeffding D statistic by using the HOEFFDING option on the PROC CORR statement. The CORR function in SAS/IML also supports a direct computation of Hoeffding's D statistic. The statistic measures the dependence between two variables.
You can validate the PROC CORR output by implementing the formula in the SAS/IML language. The formula uses not only the (tied) ranks of the variables but also the bivariate ranks of the joint pairs. You can use the BRANKS function in SAS/IML to compute the univariate and bivariate ranks.
Of course, knowing how to compute a statistic is not the same as understanding what it means or how it can be used in practice. A subsequent article explores the Hoeffding D statistic on a series of examples.

1 Comment
Pingback: Examples of using the Hoeffding D statistic - The DO Loop