Last year, I wrote almost 100 posts for The DO Loop blog. My most popular articles were about data visualization, statistics and data analysis, and simulation and bootstrapping. If you missed any of these gems when they were first published, here are some of the most popular articles from 2021:
Statistics and data analysis
- Segmented regression models: This post shows how to create a segmented regression model in SAS. The breakpoints in the model are estimated from the data. Technically, this article is from late 2020, but it attracted a lot of views in 2021.
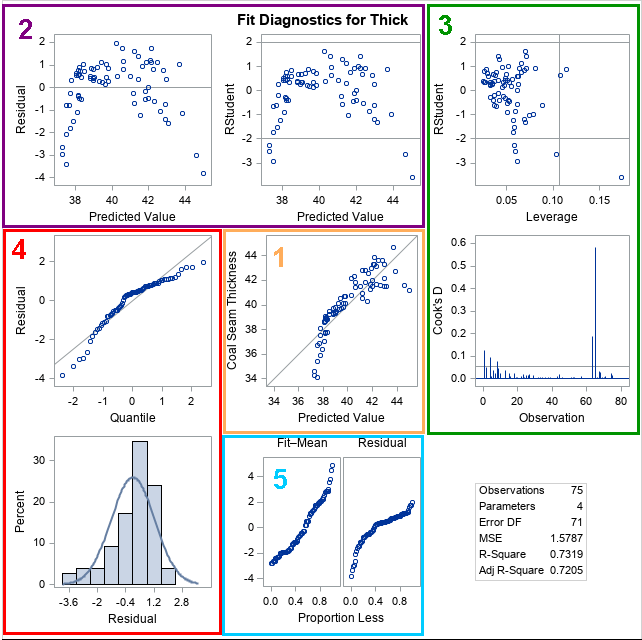
- Regression diagnostic plots in SAS: Many SAS regression procedures create diagnostic plots automatically when ODS graphics are enabled. This post shows how to interpret the plots to detect outliers and to assess whether the data and model satisfy the assumptions of linear regression, including the normality and independence of random errors. A follow-up article describes how to identify influential observations in regression models.
- Robust detection of outliers in time series: The Hampel identifier uses robust moving estimates to identify outliers in a time series. If the method identifies an outlier, you could choose to replace the extreme value with an imputed value, such as the rolling median. This process is called the Hampel filter.
SAS programming and data visualization
- Display the first or last observations in data: Whether your data are in a SAS data set or a SAS/IML matrix, this article describes how to display to print the top rows (and bottom rows!) of a rectangular data set.
- Customize titles in a visualization of BY groups: Have you ever used the BY statement to graph data across groups, such as Males/Females or Control/Experimental groups? If so, you might want to learn how to use the #BYVAR and #BYVAL keywords to customize the titles that appear on each graph.
- Reasons to prefer a horizontal bar chart: Bar charts are used to visualize the counts of categorical data. Vertical charts are used more often, but there are advantages to using a horizontal bar chart, especially if you are displaying many categories or categories that have long labels. This article shows how to create a horizontal bar chart in SAS and gives examples for which a horizontal chart is preferable.
- Why you should visualize distributions: It is common to report the means (of difference between means) for different groups in a study. However, means and standard deviations only tell part of the story. This article shows four examples where the mean difference between group scores is five points. However, when you plot the data for each example, you discover additional information about how the groups differ.

Simulation and Bootstrapping
Since I am the guy who wrote the book on statistical simulation in SAS, I am pleased that my simulation articles are popular. Simulation helps analysts understand expected values, sampling variation, and standard errors for statistics.
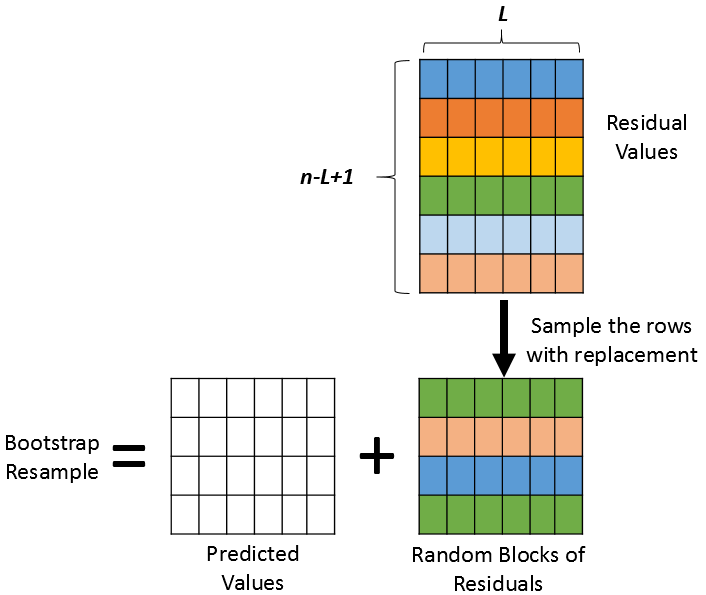
- Block bootstrap techniques for time series: Bootstrapping data from a time series is more complicated than bootstrapping data from the regular least-squares regression model. Read about how to implement a simple block bootstrap technique in SAS. In practice, analysts often prefer a more complicated bootstrap called the moving block bootstrap, in which all blocks have the same length, or a variation called the stationary block bootstrap in which blocks have random lengths.
- Monte-Carlo estimates of integrals: You can use SAS to compute Monte Carlo estimates of double integrals on a planar region. Double integrals are used to estimate probabilities for bivariate distributions. The article shows integrals over both rectangular and non-rectangular domains.
- The probability integral transformation: Did you know that any continuous distribution can be transformed into the uniform distribution on (0,1)? The function that performs this transformation is the familiar cumulative distribution function (CDF). The transformation is called the probability integral transformation and has broad applications for simulating data.
Did you resolve to learn something new in the New Year? Reading these articles requires some effort, but they provide tips and techniques that make the effort worthwhile. So, read (or re-read!) these popular articles from 2021. To ensure you don't miss a single article in 2022, consider subscribing to The DO Loop.

3 Comments
Hello Rick,
I find the quality and relevance (and frequency) of your blog posts amazing. I look forward to seeing what 2022 brings.
The above post is a good start.
Thanks,
Koen Knapen
Thanks, Koen. That means a lot coming from someone with your analytical skills.
Pingback: 12 blog posts from 2021 that deserve a second look - The DO Loop