There are times when it is useful to simulate data. One of the reasons I use simulated data sets is to demonstrate statistical techniques such as multiple or logistic regression. By using SAS random functions and some DATA step logic, you can create variables that follow certain distributions or are correlated with other variables. You might decide to simulate a drug study where the drug group has a higher or lower mean than a placebo group.
Because most programs that create simulated data use random numbers, let's start off by discussing the RAND function. This function can generate random numbers that follow distributions such as uniform, normal, Bernoulli, as well as dozens of other distributions. Veteran SAS programmers might be more familiar with some of the older random number functions such as RANUNI and RANNOR. RANUNI was used to generate uniform random numbers (numbers between 0 and 1) and RANNOR generated random numbers from a normal distribution. The RAND function has replaced all of the older functions and has a number of advantages over the older functions.
The first argument of the RAND function is the name of the distribution that you want to use, such as Uniform, Normal, or Bernoulli. For some of the distributions, such as Normal, you can supply parameters such as the mean and standard deviation. Here are some examples:
| Function | Description |
| rand('Uniform') | Generates uniform random numbers (between 0 and 1) |
| rand('Normal',100,20) | Generates values from a normal distribution with a mean of 100 and a standard deviation of 20 |
| rand('Bernoulli',.4) | Generates a 0 or 1 with a probability of a 1 equal to .4 |
| rand('Binomial',.2,5) | Generates random numbers that represent the number of successes in a sample of size 5 with the probability of success equal to .2 |
Important Note: if you want a reproducible series of random numbers using the RAND function, you must seed it by a call to STREAMINIT (with a positive integer argument) prior to its use. For example:
call streaminit(132435); |
To clarify the note above, here are two programs that use the RAND function—one with, and one without the call to Streaminit.
data Without; do i = 1 to 5; x = rand('Uniform'); output; end; drop i; run; |
Here is the output from running this program twice.
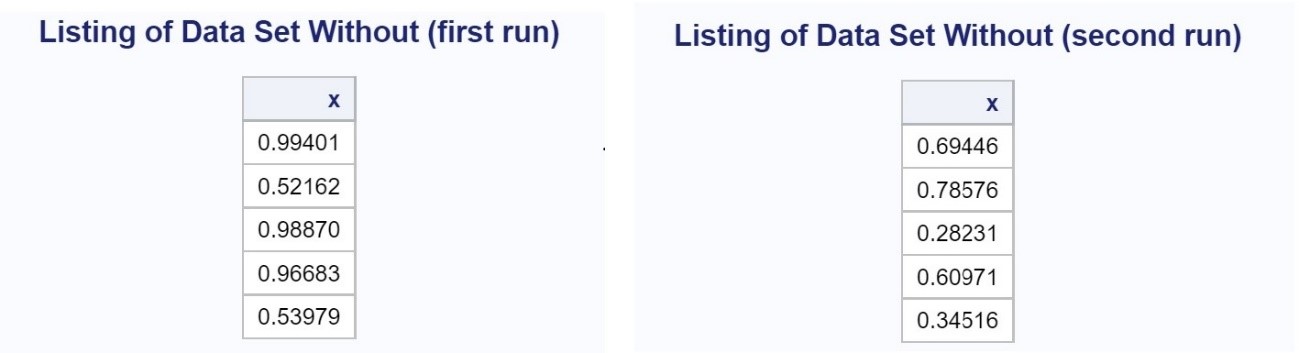
Notice that the values of x are different in each run. Now let's run the same program with CALL STREAMINIT included. Here is the program.
data With; call streaminit(13579); do i = 1 to 5; x = rand('Uniform'); output; end; drop i; run; |
And here are the output listings from running this program twice.
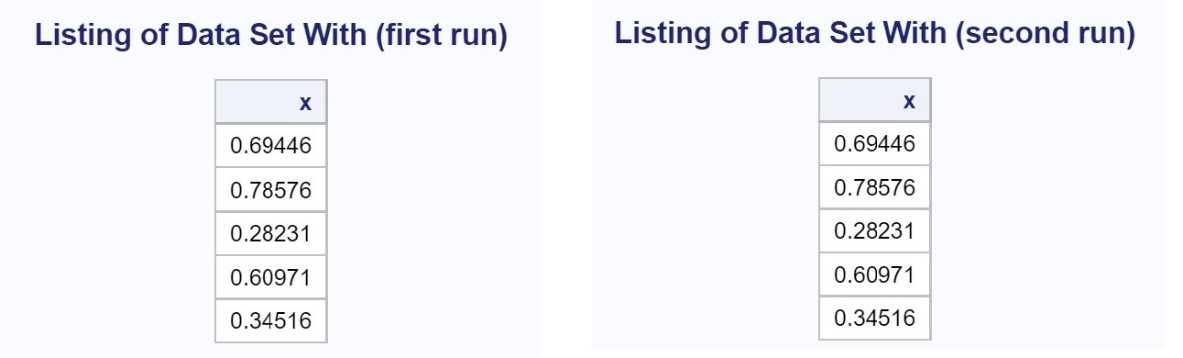
Adding CALL STREAMINIT creates the same sequence of random numbers each time the program is run. This is useful if you are generating groups for a drug study and want to be able to re-create the random sequences when it comes time to break the blind and analyze the results. Another reason I sometimes want to generate a repeatable sequence of random numbers is for problem sets included in many of my books—I want the reader to get exactly the same results as I did.
Let's switch topics and see how to write a program where you want to simulate flipping a coin. The program below uses a popular method, but not it is not as elegant as the next program I'm going to show you.
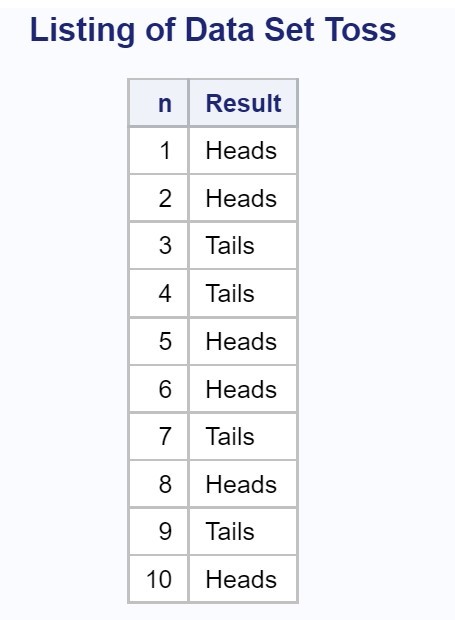
*Old fashioned way to generate "random" events; data Toss; do n = 1 to 10; if rand('uniform') lt .5 then Result = 'Tails'; else Result = 'Heads'; output; end; run; |
In the long run, half of the uniform random numbers will be less than .5, and the proportion of heads and tails will be approximately .5. Here is a listing of data set Toss.
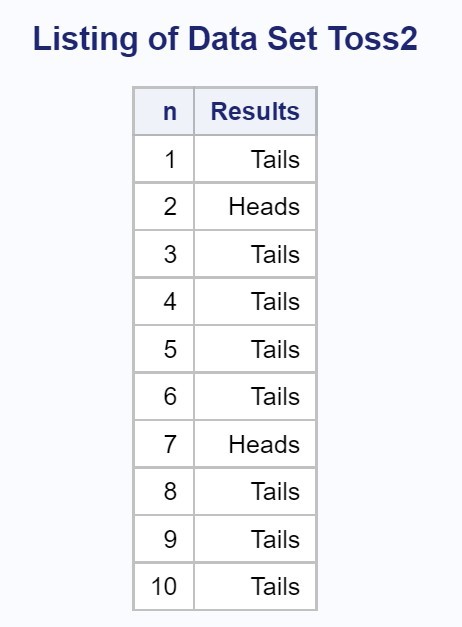
A more sophisticated approach takes advantage of the RAND function's ability to generate random number from multiple distributions. A Bernoulli distribution is similar to a coin toss where you can adjust the probability of a 1 or 0 by including a second parameter to the function. The Toss2 program, shown below, does just that.
*More sophisticated program; proc format; value Heads_Tails 0="Heads" 1="Tails"; run; data Toss2; do n = 1 to 10; Results = rand('Bernoulli',.5); format Results Heads_Tails.; output; end; run; |
The format Heads_Tails substitutes the labels "Heads" and "Tails" for values of 0 and 1, respectively. Here is a listing of data set Toss2.
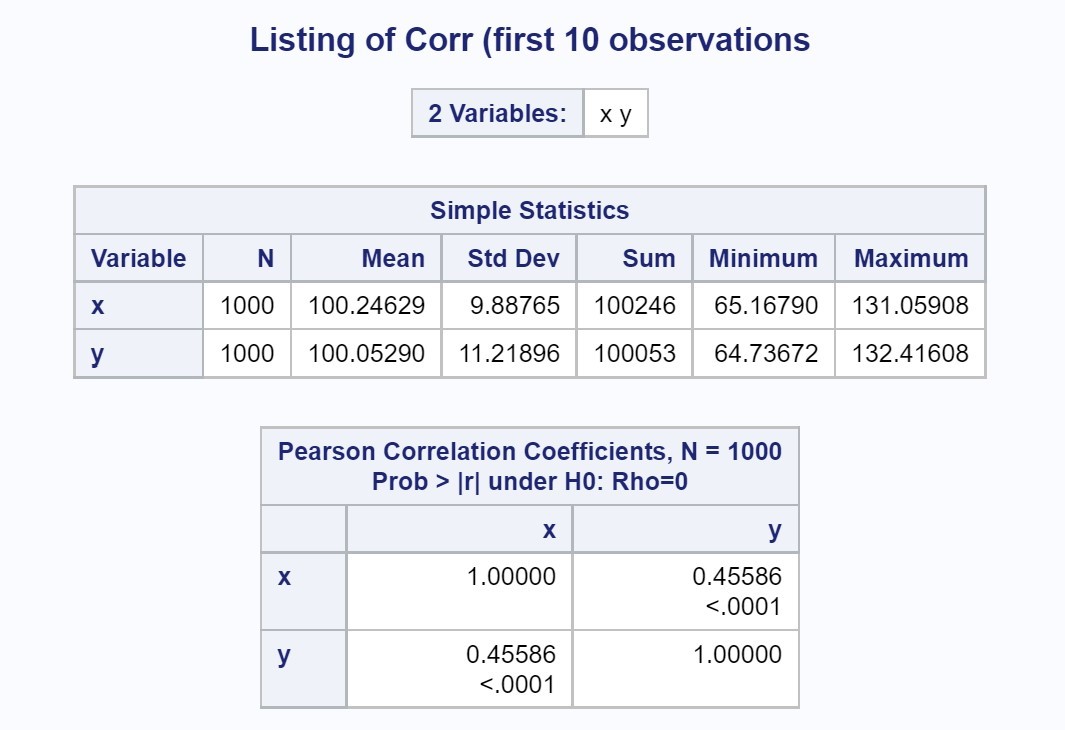
The final discussion of this blog, concerns generating random values of two or more variables that are correlated. The example that follows generates x-y pairs that are correlated.
*Creating correlated x-y pairs; data Corr; do i = 1 to 1000; x = rand('normal',100,10); y = .5*x + rand('Normal',50,10); output; end; drop i; run; |
By including a proportion of the x-value when creating the y-value, the x- and y-values will be correlated. Shown below is the output from PROC CORR, showing that x and y are correlated (r = .45586).
I used a SAS Studio task to create the scatterplot shown next.

You can increase or decrease the correlation by increasing the proportion of x used to create y. For example, you could use y = .8*x + rand('Normal',20,10); to create x-y pairs with a higher correlation.
You can see more examples of the RAND function in my book, SAS Functions by Example, Second Edition, available as an e-book from RedShelf or in print form from Amazon.
To learn more about how to use SAS Studio as part of OnDemand for Academics, to write SAS programs, or to use SAS Studio tasks, please take a look at my new book: Getting Started with SAS Programing: Using SAS Studio in the Cloud (available in e-book from RedShelf or in a paper version from Amazon).

I hope you enjoyed reading this blog and, as usual, I invite comments and/or questions.