
The future of insurance talent rests on AI

AI is revolutionizing insurance by tackling talent gaps, boosting efficiency and driving innovation.
AI is revolutionizing insurance by tackling talent gaps, boosting efficiency and driving innovation.
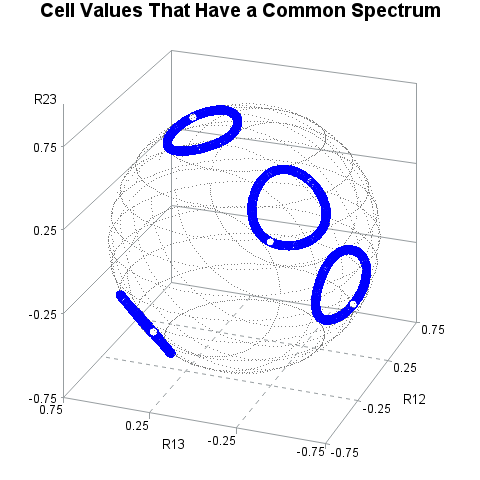
A colleague asked me an interesting question: Suppose you have a structured correlation matrix, such as a matrix that has a compound symmetric, banded, or an AR1(ρ) structure. If you generate a random correlation matrix that has the same eigenvalues as the structured matrix, does the random matrix have the

Fitting a Neural Network Model - Learn how to fit a neural network model and use your model to score new data In Part 6, Part 7, Part 9, and Part 10 of this series, we fit a logistic regression, decision tree, random forest and gradient boosting model to the

