In recent years, solar panels have become much more economical, and therefore more popular. But because of the curvature of the Earth, the angle at which you need to install the panels varies, depending on where you live. In this example, I demonstrate how to visualize this kind of data using what I call a peekaboo map.
But before we get started, here's a picture to get you into the 'solar power' mood. My friend Rich sent me this photo of a very cool solar powered house in our area that belongs to his friend Christopher. Not only does he have a solar powered house, but (indirectly) a solar powered electric car. Pretty cool, eh!

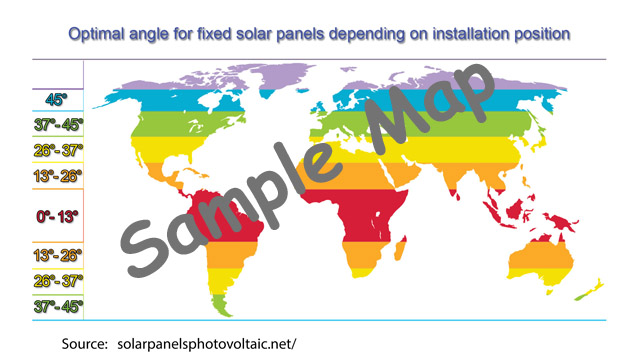
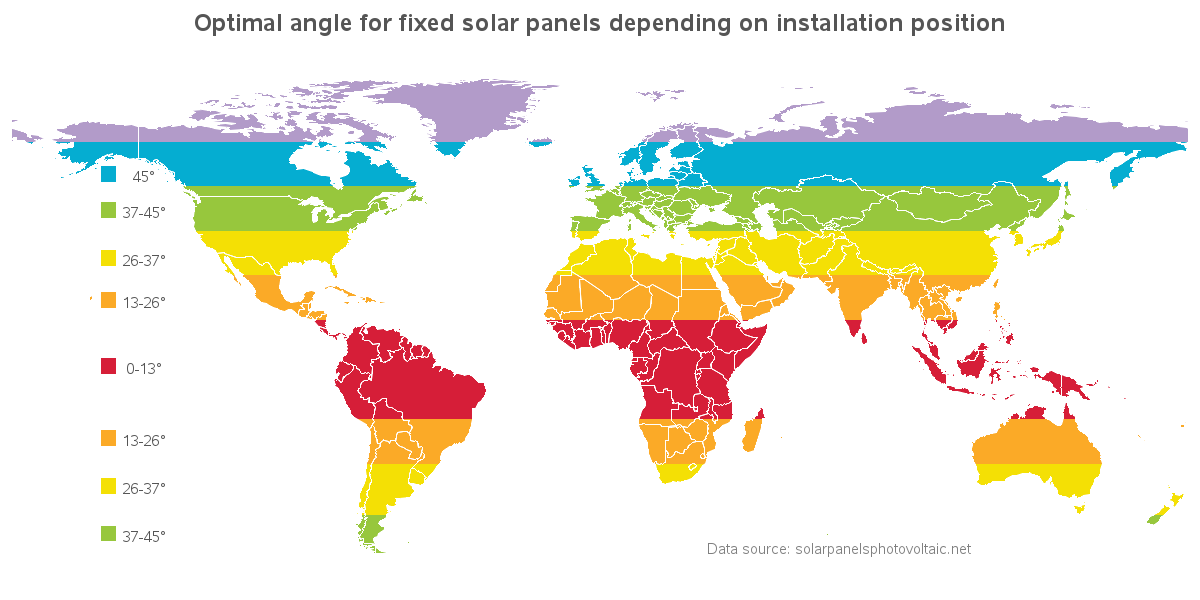
While doing a Google search on solar power, I came across the following map, which caught my attention. This map gives you a good general idea of the angle you'll need to align your solar panels, for various locations around the world. And of course I wanted to create my own version of this map, using SAS software ...
Using SAS/Graph Proc GMap, you can easily fill each map polygon (such as country or continent) with a single color. But in this map, I need to fill the polygons with multiple colors arranged in a gradient. And, the gradients also line up with certain latitude ranges in the map. In other words ... I would need to get a little tricky to create this map!
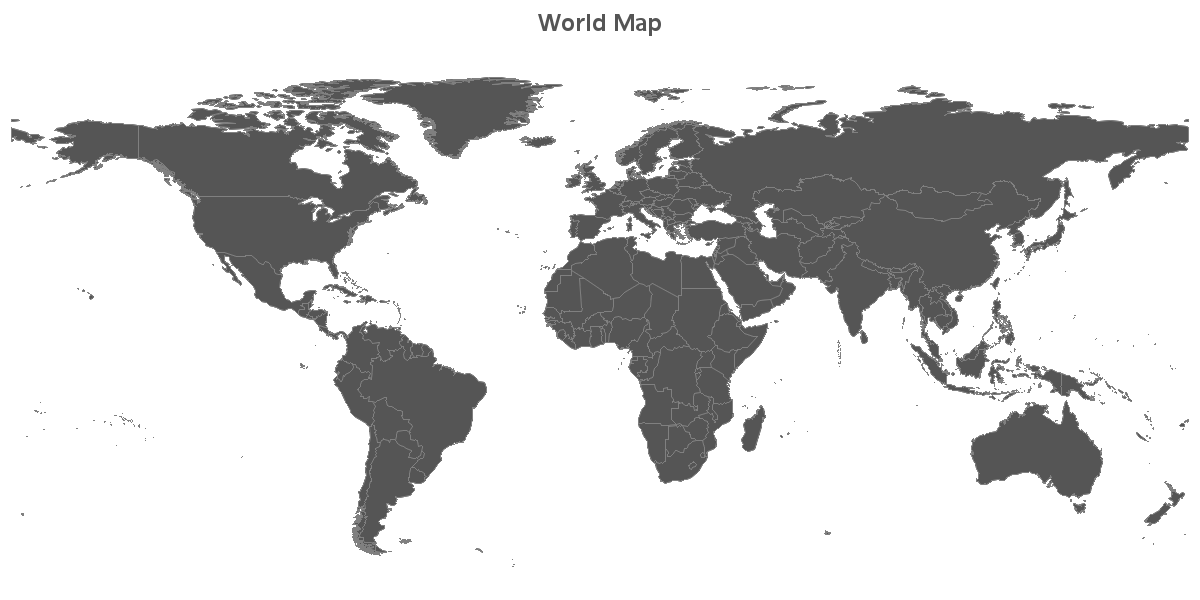
I started with a world map, and projected it with the cylindrical projection. Here's what the map looks like, with all the polygons (countries) plotted in dark gray.
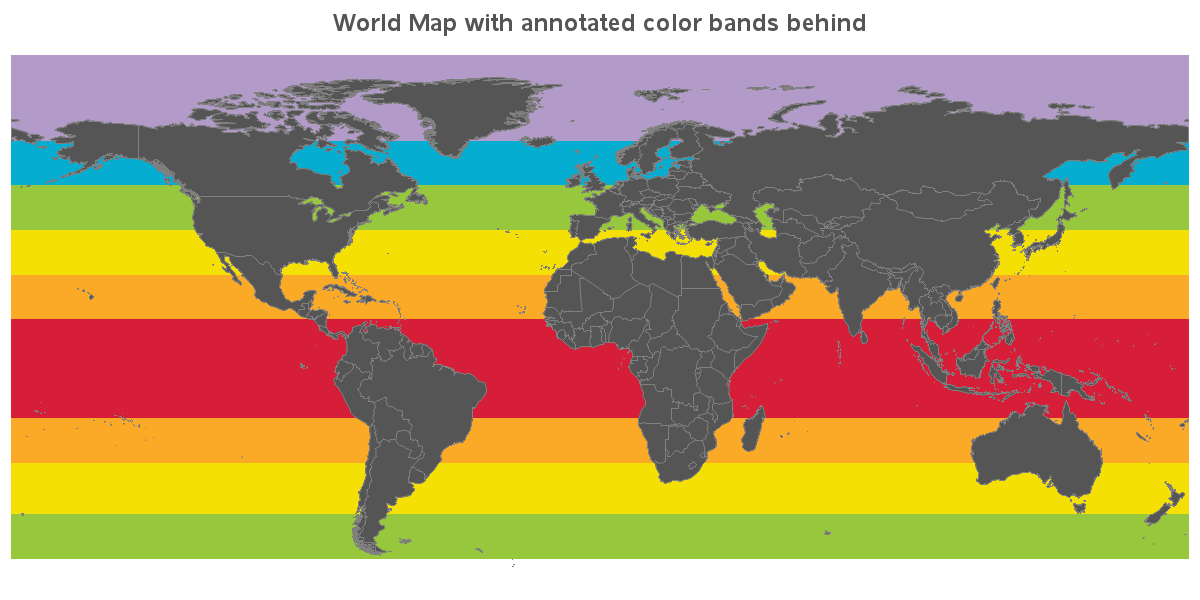
Next, I created an annotate dataset that used the bar function to draw horizontal bars of color behind the map, with the bounding coordinates of the bars being the min/max latitude & longitude. The map actually looks pretty cool to me! But it's not the map I set out to create ... not yet, anyway. Rather than the land areas being solid-colored, and the background/water being gradient colors, I want the inverse of that.
data color_bands;
length color $8;
input color min_lat max_lat;
datalines;
cxb29bc9 65 90
cx05add1 52 65
cx97c73d 39 52
cxf4e005 26 39
cxfbaa27 13 26
cxd61e38 -16 13
cxfbaa27 -29 -16
cxf4e005 -44 -29
cx97c73d -57 -44
;
run;
data color_bands; set color_bands;
length function $8 style $35;
flag=1;
xsys='2'; ysys='2'; hsys='3'; when='b';
function='move'; lat=min_lat; long=-180; output;
function='bar'; lat=max_lat; long=180; style='solid'; output;
run;
What I did to get the inverse of the above map was to create a rectangular map of the entire world, and then subtracted all the country polygons out of it as 'holes' in the map. This allows you to see the color through the country-shaped holes in the rectangular world map. I thought this type of map needed a name, and I decided to call it a peekaboo map. Here's the first version, with my rectangular map polygon colored dark gray, and the annotated colors showing through the country-shaped holes:
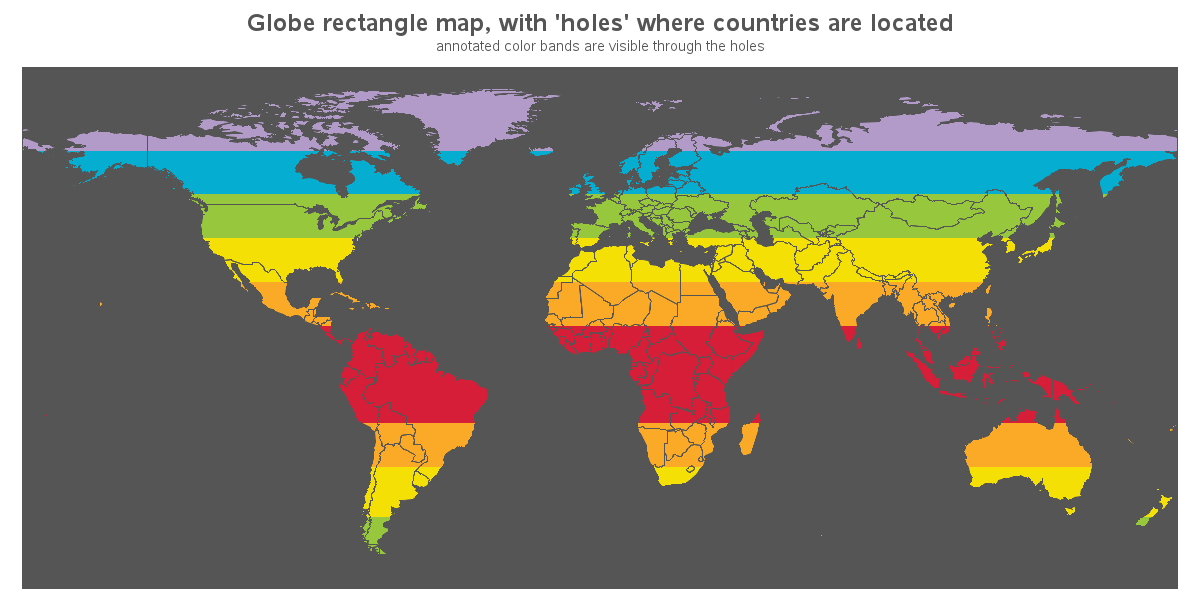
To create the final map, all I had to do was change the color in my pattern statement from gray to white, and annotate a color legend. Note that I could have used Proc GRemove to get rid of the country boundaries within each continent, but I kinda like being able to see the country borders, so I left them.
This mapping technique is pretty flexible. For example, you could easily annotate an image behind the peekaboo map, rather than the gradient color bars. What other kinds of data might you visualize using this technique? Feel free to leave some ideas/suggestions in the comments section!
Here's a link to the code, if you'd like to download it and experiment with creating your own maps.
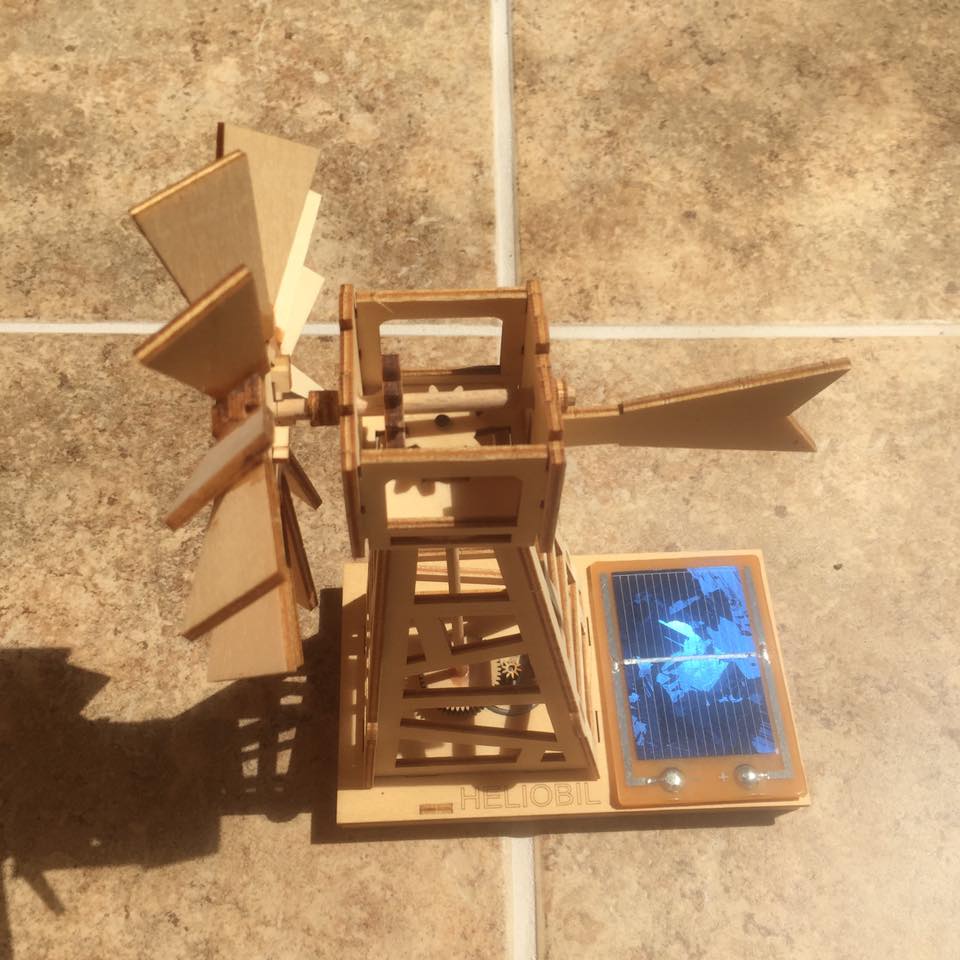
And I'll close this blog post on a lighter note, with a picture of a whimsical solar powered windmill (think about that for a second!) This was built by my friend David, from a kit that his wife gave him for Christmas a couple of years ago. He says it's been grinding away faithfully every sunny day since then!