In recent versions of SAS/Graph, we have been shipping new/updated maps of each country, with 2 levels of detail (such as state & county, or province & division). But what if you only want a map showing the higher level of detail? In this blog post I share my third tip on mapping tools available in SAS - the basics of removing internal borders, using Proc GRemove.
Before we get started, here's another interesting map-related photo from my friend Rich. This is a picture, of a poster, of an old map showing the history of the county borders surveyed in the state of North Carolina. We don't normally think about borders changing, but they occasionally do - and this is why it's a really great thing that SAS has a deal with GfK to get new/updated maps on a regular basis, which we then provide to our SAS/Graph customers.

Speaking of borders, let's get rid of some unwanted internal borders!
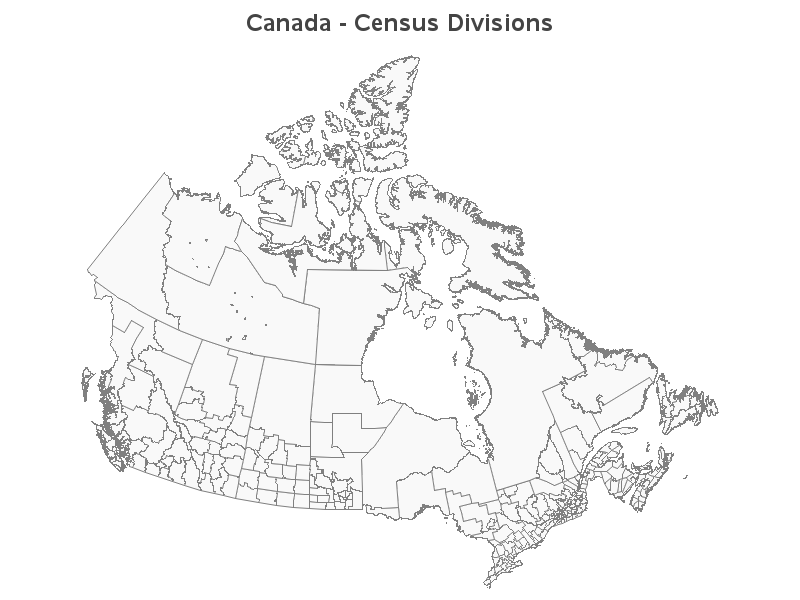
Most of the new SAS country maps (in the mapsgfk library) contain polygons at the "second level" of granularity in each country, identified by their 'id' variable. Recently, I've had several people ask me about Canadian maps, therefore I'll use that as my example. Here is a plot of the polygons in the mapsgfk.canada dataset - the polygons represent census divisions:
pattern1 v=s c=grayf9 repeat=1000;
proc gmap map=mapsgfk.canada data=mapsgfk.canada_attr;
id id;
choro idname / nolegend coutline=gray;
run;
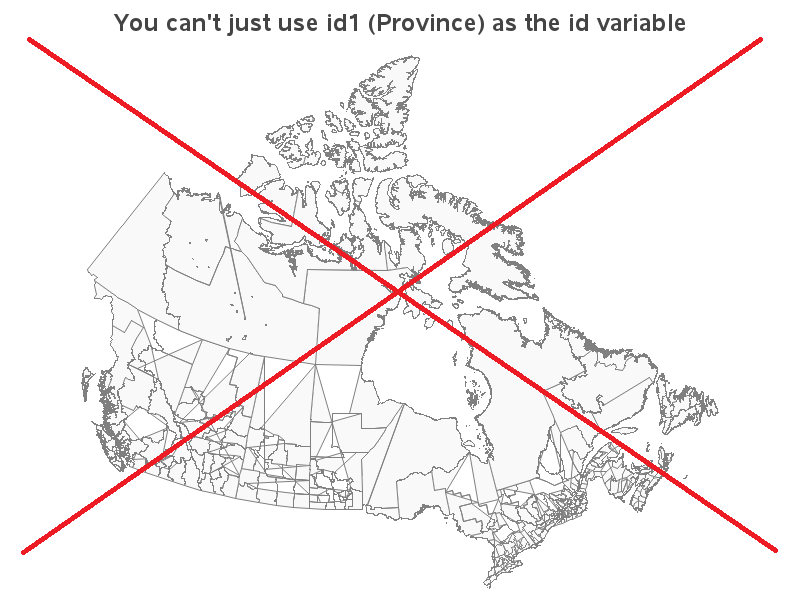
But what if you want to map your data by province? You can't simply use id1 (province code) as the id variable, or you get a scrambled looking map like this:
proc gmap map=mapsgfk.canada data=mapsgfk.canada_attr;
id id1;
choro idname / nolegend coutline=gray;
run;
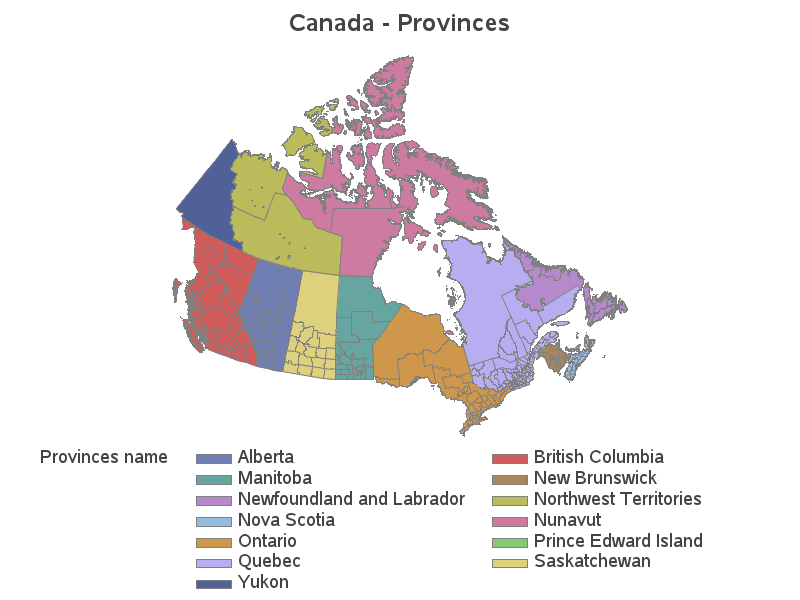
You can easily 'color' the map by province using id1 or id1name in the choro statement, but it's still got the internal census division borders. And if you color the map by province, then you can't color it by your response variable such as population or sales (because you're already using color for another purpose).
goptions reset=pattern;
proc gmap map=mapsgfk.canada data=mapsgfk.canada_attr;
id id;
choro id1name / coutline=gray;
run;
The solution is to use Proc GRemove, to remove the internal (census division) borders, and create a new map! It's actually very simple, and you should be able to re-use this code for just about any mapsgfk country map. (Tip: if you're using one of your own maps with different variable names, and your map isn't coming out right, then try switching the variables you're using in 'by' and 'id' - you've probably got them reversed!)
proc gremove data=mapsgfk.canada out=my_map;
by id1;
id id;
run;
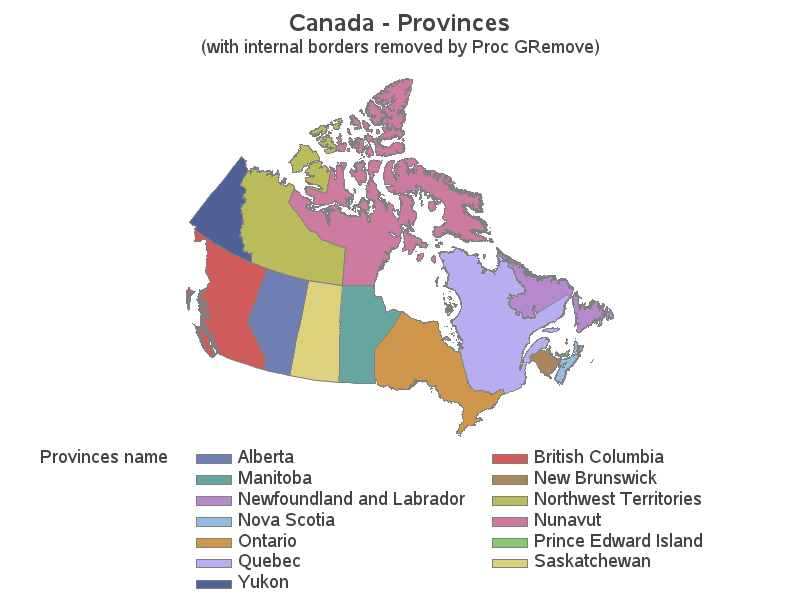
Now the census district borders are gone, and you have a new map containing just the province polygons. You can now use id1 (province code) as the id, as the map below demonstrates. For simplicity, I'm coloring the provinces by province name, but you could similarly use other response data (such as population or sales).
proc gmap map=my_map data=mapsgfk.canada_attr;
id id1;
choro id1name / coutline=gray;
run;
Hopefully you'll get a lot of mileage out of this tip, and create some really great maps! Feel free to let us know what maps you've created with Proc GRemove in the comments, or provide any additional GRemove tips you think might be helpful...
Click here to see all my tips about mapping tools!


1 Comment
Thanks Robert,
We will be using this in our VA Stored Processes for custom mapping in our environment.
Cheers once again.