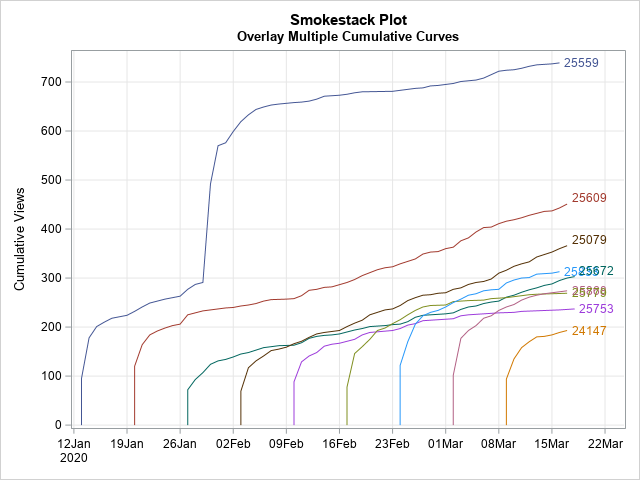
Smokestack plots: A visualization technique for comparing cumulative curves

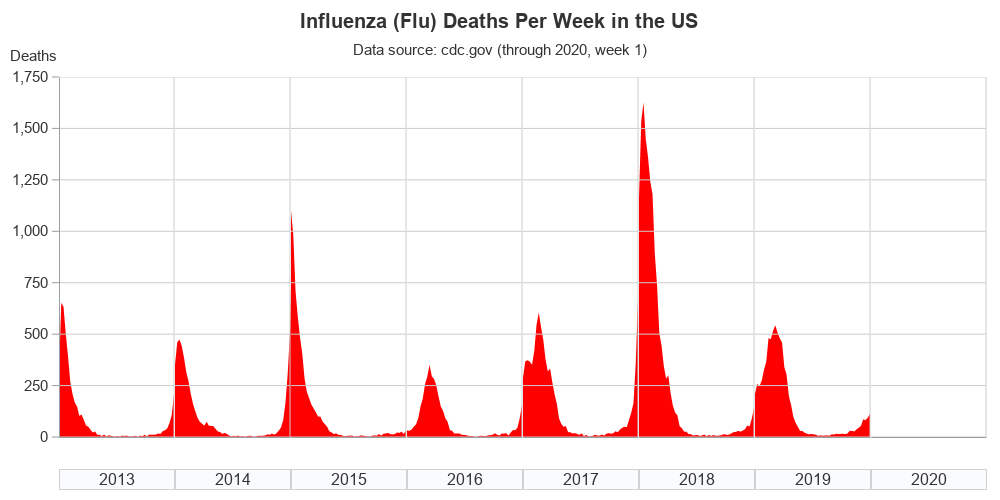
A cumulative curve shows the total amount of some quantity at multiple points in time. Examples include: Total sales of songs, movies, or books, beginning when the item is released. Total views of blog posts, beginning when the post is published. Total cases of a disease for different countries, beginning