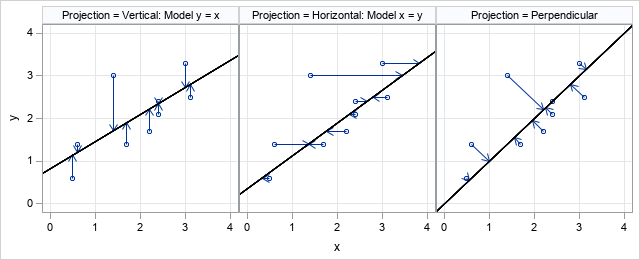
A SAS programmer wanted to create a graph that illustrates how Deming regression differs from ordinary least squares regression. The main idea is shown in the panel of graphs below.
- The first graph shows the geometry of least squares regression when we regress Y onto X. ("Regress Y onto X" means "use values of X to predict Y.") The residuals for the model are displayed as vectors that show how the observations are projected onto the regression line. The projection is vertical when we regression Y onto X.
- The second graph shows the geometry when we regress X onto Y. The projection is horizontal.
- The third graph shows the perpendicular projection of both X and Y onto the identity line. This is the geometry of Deming regression.
This article answers the following two questions:
- Given any line and any point in the plane, how do you find the location on the line that is closest to the point? This location is the perpendicular projection of the point onto the line.
- How do you use the SGPLOT procedure in SAS to create the graphs that chow the projections of points onto lines?
The data for the examples are shown below:
data Have; input x y @@; datalines; 0.5 0.6 0.6 1.4 1.4 3.0 1.7 1.4 2.2 1.7 2.4 2.1 2.4 2.4 3.0 3.3 3.1 2.5 ; |
The projection of a point onto a line
Assume that you know the slope and intercept of a line: y = m*x + b.
You can use calculus to show that the projection of the point (x0, y0) onto the line is the point (xL, yL) where
xL = (x + m*(y – b)) / (1 + m2) and
yL = m * xL + b.
To derive this formula, you need to solve for the point on the line that minimizes the distance from (x0, y0) to the line.
Let (x, m*x + b) be any point on the line. We want to find a value of x so that the distance from (x0, y0) to (x, m*x + b) is minimized.
The solution that minimizes the distance also minimizes the squared distance, so define the squared-distance function
f(x) = (x - x0)2 + (m*x + b - y0)2.
To find the location of the minimum for this function, set the derivative equal to zero and solve for the value of x:
- f`(x) = 2(x - x0) + 2 m*(m*x + b - y0)
- Set f`(x)=0 and solve for x. The solution is the value xL = (x + m*(y – b)) / (1 + m2), which minimizes the distance from the point to the line.
- Plug xL into the formula for the line to find the corresponding vertical coordinate on the line: yL = m * xL + b.
You can use the previous formulas to write a simple SAS DATA step that projects each observation onto a specified line. (For convenience, I put the value of the slope (m) and intercept (b) into macro variables.) The following DATA step projects a set of points onto the line y = m*x + b. You can use PROC SGPLOT to create a scatter plot of the observations. Use the VECTOR statement to draw the projections of the points onto the line.
/* projection onto general line of the form y = &m*x + &b */ %let b = 0.4; %let m = 0.8; data Want; set Have; xL = (x + &m *(y - &b)) / (1 + &m**2); yL = &m * xL + &b; run; title "Projection onto Line y=&m x + &b"; proc sgplot data=Want aspect=1 noautolegend; scatter x=x y=y; vector x=xL y=yL / xorigin=x yorigin=y; /* use the NOARROWHEADS option to suppress the arrow heads */ lineparm x=0 y=&b slope=&m / lineattrs=(color=black); xaxis grid; yaxis grid; run; |
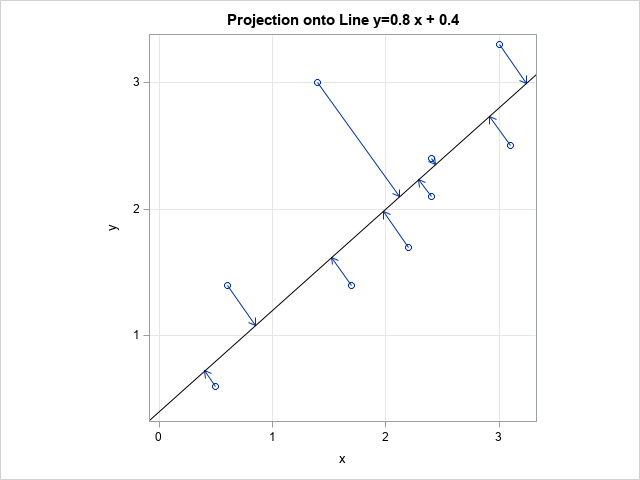
You can get the graph for Deming regression by setting b=0 and m=1 in the previous formulas and program.
In summary, you can use that math you learned in high school to find the perpendicular projection of a point onto a line. You can then use the VECTOR statement in PROC SGPLOT in SAS to create a graph that illustrates the projection. Such a graph is useful for comparing different kinds of regressions, such as comparing least-squares and Deming regression.

6 Comments
The problem with this Deming regression is that it assumes that x and y have the same dimension and units. But how do you define the orthogonal distance if e.g. x=voltage and y=current?
In my opinion, multidirectional regression makes more sense, since it doesn't have that problem.
http://www.physicsjournal.net/article/view/30/3-3-11
If you follow the link in this article, you will find an article on Deming regression that does not use the same units for X and Y. It shows how to use the variances and covariance to set up and solve the regression problem.
Thanks for answering, but I don't really see how this answers my question. My method ("multidirectional least squares regression") doesn't have this problem. I would very much like to know your opinion about it!
http://www.physicsjournal.net/article/view/30/3-3-11
It appears that you have re-discovered the fact that you can choose different regression methods, depending on the assumptions in the model (which variable, if any, are measured without error) and the quantity that you are trying to minimize. In addition to the classical least-squares regression (which minimizes the VERTICAL difference between observed and predicted Y values), there are other regression methods that minimize other quantities. Look up principal component regression, which minimizes the perpendicular distance. There are other options as well, including "partial least squares" and "reduced ridge regression," which are used when the data/experiment does not satisfy the assumptions of least squares regression. I suggest you walk over to the Statistics department at your university and have a chat with one of the statsiticans there. They can explain how the ideas in your paper related to known statistical methods.
I know these things, but it seems I didn't "re"invent anything. I did not find my method anywhere else and I did discuss with many statisticians. You may criticize it, but please first have a serious look at it!
https://www.researchgate.net/profile/Koen-Van-De-Moortel/research
Thanks for writing and for sharing your ideas. Best wishes on your research.